. 2012 Jan 9;196(1):47-64.
doi: 10.1083/jcb.201106022.

Dynein-dependent processive chromosome motions promote homologous pairing in C. elegans meiosis

Affiliations

Dynein-dependent processive chromosome motions promote homologous pairing in C. elegans meiosis

David J Wynne et al. J Cell Biol. .

Abstract

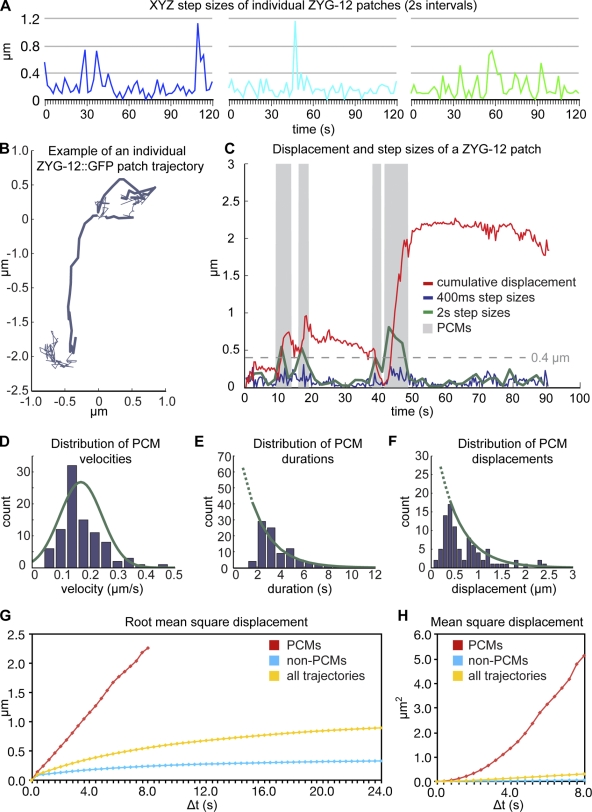
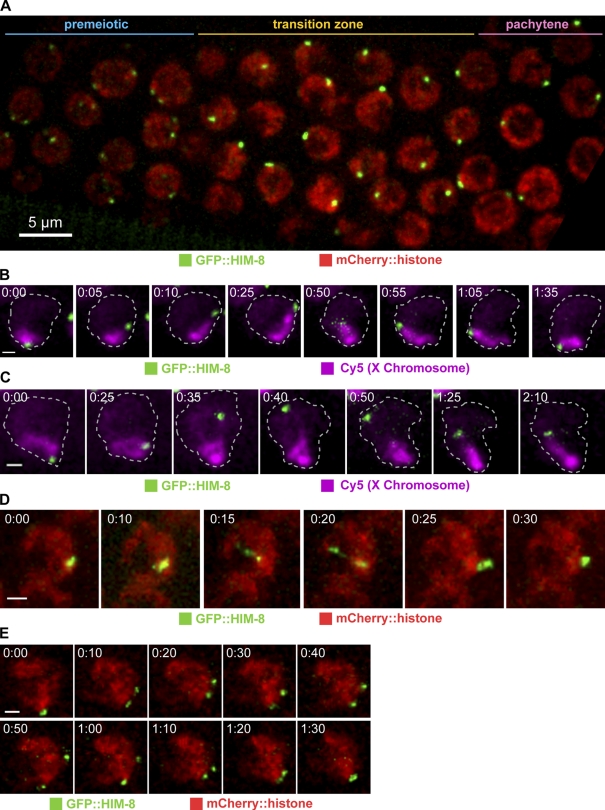
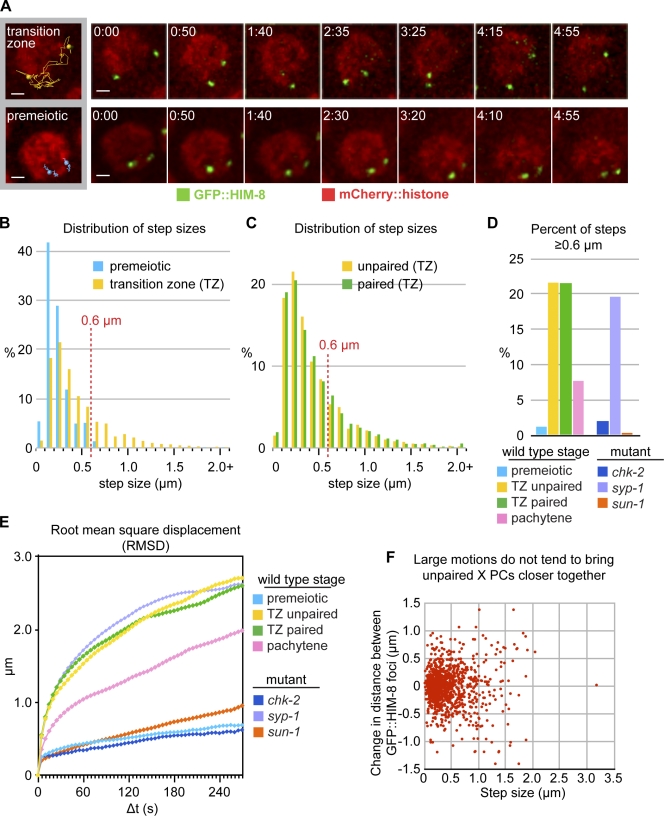
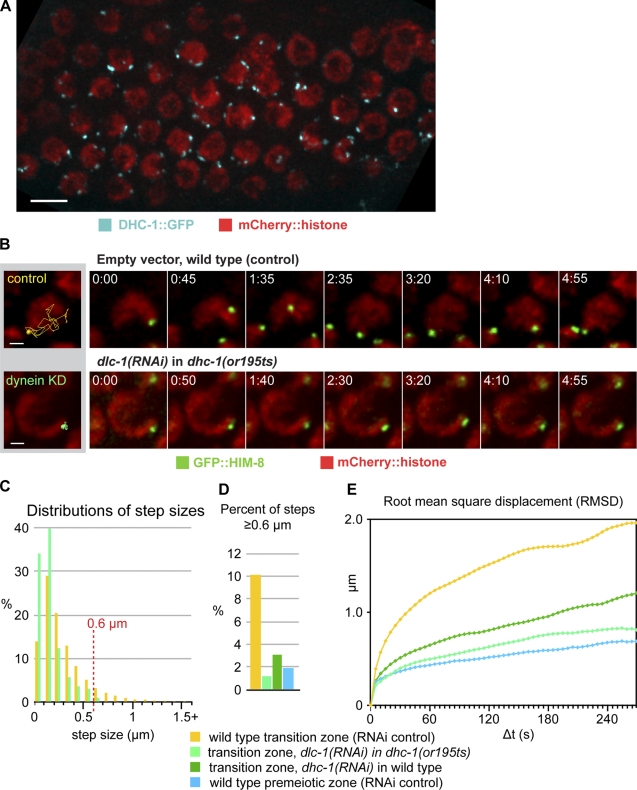
Meiotic chromosome segregation requires homologue pairing, synapsis, and crossover recombination, which occur during meiotic prophase. Telomere-led chromosome motion has been observed or inferred to occur during this stage in diverse species, but its mechanism and function remain enigmatic. In Caenorhabditis elegans, special chromosome regions known as pairing centers (PCs), rather than telomeres, associate with the nuclear envelope (NE) and the microtubule cytoskeleton. In this paper, we investigate chromosome dynamics in living animals through high-resolution four-dimensional fluorescence imaging and quantitative motion analysis. We find that chromosome movement is constrained before meiosis. Upon prophase onset, constraints are relaxed, and PCs initiate saltatory, processive, dynein-dependent motions along the NE. These dramatic motions are dispensable for homologous pairing and continue until synapsis is completed. These observations are consistent with the idea that motions facilitate pairing by enhancing the search rate but that their primary function is to trigger synapsis. This quantitative analysis of chromosome dynamics in a living animal extends our understanding of the mechanisms governing faithful genome inheritance.


Figures

Figure 1.
Figure 1.
ZYG-12::GFP patches exhibit heterogeneous, independent trajectories along the NE. (A) Diagram of an adult C. elegans hermaphrodite indicating the temporospatial organization of germline nuclei. The rectangle indicates the TZ region imaged in C. ONM, outer nuclear membrane; INM, inner nuclear membrane. (B) Diagram of the organization of NE patches, showing a PC bound by HIM-8 and the associated aggregate of SUN-1 and ZYG-12. (C) Projection of one time point, comprising 33 optical sections (spanning a depth of 6 µm) showing ZYG-12::GFP in TZ nuclei. Meiosis progresses from left to right. (D) Selected projections showing a single TZ nucleus. In the bottom images, colored spheres mark two patches that merge and split (nuclear surface is indicated by a circle in the first image). (E) Colored tracks indicate all the steps for patches shown in D. (F) Selected frames showing a nucleus with six ZYG-12 patches (top) and overlays of the segmented patches (bottom). (G) Colored tracks indicate all the steps for patches shown in F over a 2-min time course. (H) Colored tracks representing all steps over a 2-min time course for all patches in three representative nuclei; each nucleus is shown from two orthogonal viewpoints to highlight the distribution of patches spanning the entire NE. Dotted lines indicate the nuclear surface. Times are given in minutes and seconds. Bars: (C) 5 µm; (D–H) 1 µm.
Figure 2.
Figure 2.
Rapid 2D imaging enables two modes of motion to be distinguished. (A) Plots depicting xyz step sizes between each time point for three patches shown in Fig. 1 (F and G). Plot colors correspond to patch color in time-lapse images. (B) Trajectory of a single ZYG-12 patch followed at 400-ms intervals. Bold segments denote processive chromosome motions (PCMs). (C) Cumulative distance plot for the single representative trajectory shown in B. Green line shows step sizes observed between every five frames (2-s intervals). (D) Speed distribution of ZYG-12 PCMs. Green line shows fitted normal distribution. n = 91 PCMs. (E and F) Distributions of durations (E) and total displacements (F) of ZYG-12 PCMs. Green lines show fitted exponential decay; dotted lines show extrapolation to shorter times. (G and H) RMSD and MSD plots for PCMs, non-PCMs, and all trajectories. The limited duration of PCMs allows RMSD analysis up to only 8 s.
Figure 3.
Figure 3.
GFP::HIM-8 reveals X PC dynamics. (A) Projection image of 12 optical sections from a single time point showing a field of nuclei expressing GFP::HIM-8 and mCherry::histone. Meiosis progresses from left to right. At the left edge of the field, nuclei have not yet entered meiosis. Pachytene nuclei lacking a crescent-shaped chromosome mass are seen toward the right. (B and C) Projections of selected time points showing a single nucleus expressing GFP::HIM-8 in which the X chromosome is visualized by Cy5-dUTP incorporation. Nuclear outlines are based on the mCherry::histone signal (not depicted). The dotted lines demarcate the nuclear outline, as observed by imaging of mCherry::histone. (D and E) Projections of selected time points showing GFP::HIM-8 (red) and mCherry::histone. These examples show nuclei in which X PCs (green) stretch (D) or dissociate temporarily (E) after colocalizing. Times are given in minutes and seconds. Bars: (A) 5 µm; (B–E) 1 µm.
Figure 4.
Figure 4.
PCMs are regulated by meiotic progression but not by pairing. (A) Projections of selected time points showing GFP::HIM-8 and mCherry::histone from single nuclei in the TZ or the premeiotic zone. The left images show complete X PC trajectories overlaid on a projection of the initial time point. Times are given in minutes and seconds. Bars, 1 µm. (B) Step-size distributions of X PCs in premeiotic zone nuclei and TZ nuclei with unpaired X PCs (premeiotic: 2,248 steps, 38 trajectories, and 3 datasets; TZ unpaired: 1,443 steps, 26 trajectories, and 3 datasets). Mann–Whitney U test, P = 10−212. (C) Step-size distributions of unpaired and paired X PCs in TZ nuclei (TZ paired: 3,779 steps, 65 trajectories, and 6 datasets). Mann–Whitney U test, P = 0.85. (D) Fraction of steps >0.6 µm in different meiotic stages and in syp-1(me17), chk-2(me64) and sun-1(jf18) mutant animals (syp-1(me17): 2,698 steps, 45 trajectories, and 3 datasets; chk-2(me64): 1,620 steps, 30 trajectories, and 2 datasets; sun-1(jf18): 2,650 steps, 45 trajectories, and 3 datasets). (E) RMSD plots for all trajectories. The plateau at ∼2.5 µm reflects the distance limit for travel on the surface of a sphere ∼3.5 µm in diameter. (F) The change in distance between unpaired GFP::HIM-8 foci in TZ nuclei (vertical axis) is plotted as a function of the size of individual steps (horizontal axis). Longer steps, corresponding to PCMs, do not tend to bring X PCs closer together.
Figure 5.
Figure 5.
PCMs are dependent on MTs but not on actin. (A) Projections of selected time points showing TZ nuclei expressing GFP::HIM-8 and mCherry::histone. X chromosomes are selectively labeled by incorporation of Cy5-dUTP. Animals were injected with colchicine, latrunculin A, or buffer. Bars, 1 µm. Leftmost images show the complete GFP::HIM-8 trajectory for each 5-min series overlaid on a projection of the initial z stack. Times are given in minutes and seconds. (B) Distributions of step sizes from worms injected with colchicine (left) or latrunculin A (right) compared with controls (colchicine: 2,583 steps, 46 trajectories, and 2 datasets; latrunculin A: 1,363 steps, 24 trajectories, and 1 dataset; buffer injected: 1,855 steps, 32 trajectories, and 1 dataset; bins = 0.1 µm). (C) Fraction of steps >0.6 µm observed for each condition. (D) RMSD plots for all trajectories analyzed in B and C.
Figure 6.
Figure 6.
Dynein activity is required for PCMs. (A) Maximum intensity projection image from a recording of a hermaphrodite expressing DHC-1::GFP and mCherry::histone. Meiotic progression is from left to right; TZ nuclei show prominent dynein foci at the nuclear surface. Bar, 5 µm. (B) Selected projection images from a time series showing GFP::HIM-8 and mCherry::histone from single nuclei in the TZ of dynein knockdown (KD; dlc-1 RNAi in dhc-1(or195ts)) or WT control animals. (left) Tracks represent all steps over a 5-min data collection superimposed on a projection image from a single frame. Bars, 1 µm. (C) Distributions of step sizes in TZ nuclei from dynein knockdown (dlc-1 RNAi in dhc-1(or195ts)) animals compared with TZ nuclei of RNAi control animals (dynein knockdown [dlc-1 RNAi in dhc-1(or195ts)]: 2,599 steps, 45 trajectories, and 3 datasets; control RNAi: 2,588 steps, 45 trajectories, and 3 datasets). Bins = 0.1 µm. (D) Proportion of steps >0.6 µm under the indicated conditions; data from WT premeiotic nuclei are shown for comparison (dynein knockdown [dhc-1 RNAi 30 h]: 2,396 steps, 40 trajectories, and 3 datasets). (E) RMSD plots for all trajectories. Colors correspond to those in D.
Figure 7.
Figure 7.
Dynein-dependent and -independent chromosome mobility contributes to homologue pairing in early meiotic nuclei. (A) To visualize the search radius of PCs under different conditions, 40 GFP::HIM-8 tracks from WT TZ, WT premeiotic, or TZ in dynein knockdown (dlc-1 RNAi in dhc-1(or195ts)) nuclei were rotated about a 3.5-µm-diameter sphere such that all tracks initiate at the same point. (B) RMSD plots for all GFP::HIM-8 trajectories in WT TZ nuclei, the same data with PCMs computationally removed, in TZ nuclei from dynein knockdown animals, and in premeiotic nuclei. (C) Example of a simulated collision between two objects traveling in random walks on the surface of a sphere. The star indicates the point at which the objects come within 200 nm at the same time point. (D) Comparison of time required to achieve collision in 95% of simulations based on motion parameters measured for the indicated conditions. Collision times were calculated from ≥10 independent sets of 100 simulations; error bars indicate the SD for all sets. See Materials and methods for details.

References

    1. Agard D.A., Hiraoka Y., Shaw P., Sedat J.W. 1989. Fluorescence microscopy in three dimensions. Methods Cell Biol. 30:353–377 10.1016/S0091-679X(08)60986-3 - DOI - PubMed
    1. Bass H.W., Riera-Lizarazu O., Ananiev E.V., Bordoli S.J., Rines H.W., Phillips R.L., Sedat J.W., Agard D.A., Cande W.Z. 2000. Evidence for the coincident initiation of homolog pairing and synapsis during the telomere-clustering (bouquet) stage of meiotic prophase. J. Cell Sci. 113:1033–1042 - PubMed
    1. Baudrimont A., Penkner A., Woglar A., Machacek T., Wegrostek C., Gloggnitzer J., Fridkin A., Klein F., Gruenbaum Y., Pasierbek P., Jantsch V. 2010. Leptotene/zygotene chromosome movement via the SUN/KASH protein bridge in Caenorhabditis elegans. PLoS Genet. 6:e1001219 10.1371/journal.pgen.1001219 - DOI - PMC - PubMed
    1. Carlton P.M., Boulanger J., Kervrann C., Sibarita J.B., Salamero J., Gordon-Messer S., Bressan D., Haber J.E., Haase S., Shao L., et al. 2010. Fast live simultaneous multiwavelength four-dimensional optical microscopy. Proc. Natl. Acad. Sci. USA. 107:16016–16022 10.1073/pnas.1004037107 - DOI - PMC - PubMed
    1. Chen, H., W.K. Clyborne, J.W. Sedat, and D.A. Agard. 1992. PRIISM: an integrated system for display and analysis of 3-D microscope images. In Biomedical Image Processing and Three-Dimensional Microscopy. Vol. 784. R.S. Acharya, C.J. Cogswell, and D.B. Goldgof, editors. SPIE, Bellingham, WA. 10.1117/12.59604.

Publication types

MeSH terms