. 2012 Jan 9;196(1):103-14.
doi: 10.1083/jcb.201105127.

The septin cytoskeleton facilitates membrane retraction during motility and blebbing

Affiliations

The septin cytoskeleton facilitates membrane retraction during motility and blebbing

Julia K Gilden et al. J Cell Biol. .

Abstract

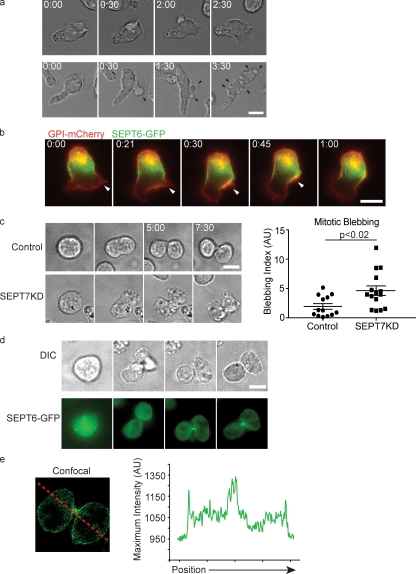
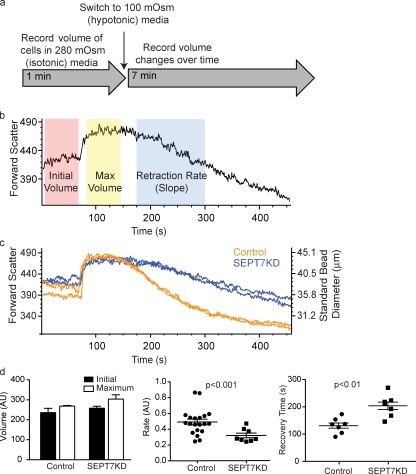
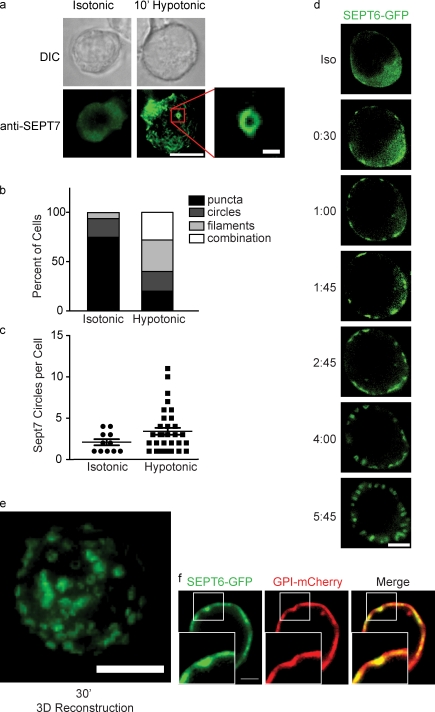
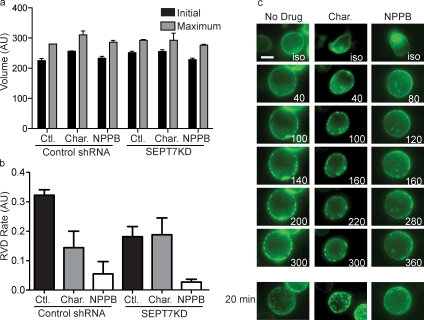
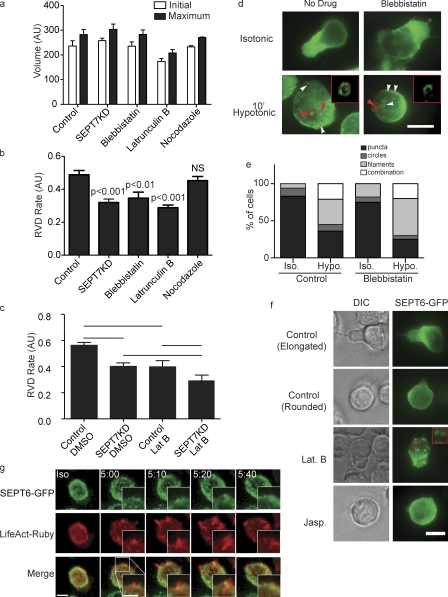
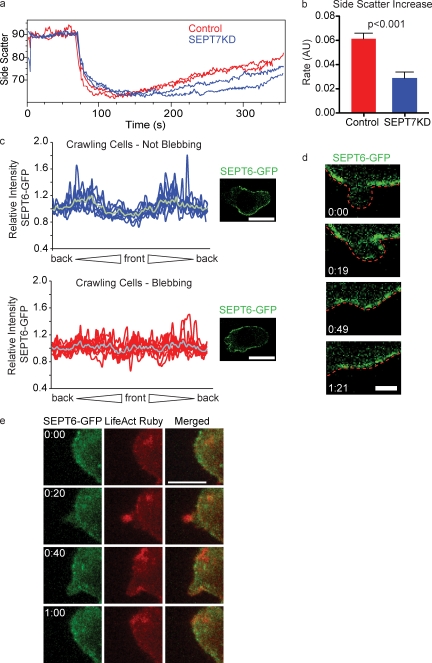
Increasing evidence supports a critical role for the septin cytoskeleton at the plasma membrane during physiological processes including motility, formation of dendritic spines or cilia, and phagocytosis. We sought to determine how septins regulate the plasma membrane, focusing on this cytoskeletal element's role during effective amoeboid motility. Surprisingly, septins play a reactive rather than proactive role, as demonstrated during the response to increasing hydrostatic pressure and subsequent regulatory volume decrease. In these settings, septins were required for rapid cortical contraction, and SEPT6-GFP was recruited into filaments and circular patches during global cortical contraction and also specifically during actin filament depletion. Recruitment of septins was also evident during excessive blebbing initiated by blocking membrane trafficking with a dynamin inhibitor, providing further evidence that septins are recruited to facilitate retraction of membranes during dynamic shape change. This function of septins in assembling on an unstable cortex and retracting aberrantly protruding membranes explains the excessive blebbing and protrusion observed in septin-deficient T cells.


Figures

Figure 1.
Figure 1.
Septins regulate cortical stability. (a) D10 T cells crawling on ICAM-1–coated glass display periodic membrane blebs and protrusions (black arrowheads). (b) Fluorescent images of D10 T cells expressing GPI-mCherry and SEPT6-GFP indicate that leading edge protrusions (white arrowheads) retract into the septin collar. n = 18. (c) Control and SEPT7KD cells were cell cycle synchronized with nocodazole and then released for imaging. Time-lapse images indicate profound blebbing during cytokinesis among SEPT7KD cells. A blebbing index consisting of the number of blebs divided by the time observed times the cell perimeter was calculated for each cell and indicates significantly elevated blebbing in SEPT7KD cells. Error bars represent SEM. AU, arbitrary unit. (d) Differential interference contrast (DIC) and SEPT6-GFP fluorescence time-lapse images of cells undergoing mitosis as in c, demonstrating accumulations of septin complexes at the midbody late in cytokinesis. (e) A confocal image and linescan demonstrating that a population of SEPT6-GFP remains localized to the cortex during mitosis. The red line indicates the path of the linescan. Bars, 10 µm.
Figure 2.
Figure 2.
SEPT7KD cells show slowed retraction in an osmotic swelling assay. (a) A schematic of a flow cytometry osmotic swelling assay. D10 T cells are suspended in isotonic media, and their volumes are recorded for 1 min. Cells are then switched to 100 mOsm media and returned to the flow cytometer, where changes in their volume are recorded over time. (b) Sample data from osmotic swelling assay indicating time periods in which measurements of initial volume, maximum volume, and retraction (RVD) rate are made. (c) Data from flow cytometry osmotic swelling assay demonstrating normal initial and maximum volumes but slowed RVD in SEPT7KD cells compared with controls. The right axis indicates bead size corresponding with forward scatter values for reference. Two independent samples from each group are shown. (d) Pooled data from four independent experiments showing equivalent initial and maximum volumes for control and SEPT7KD cells but slower RVD rates (P < 0.001) and times to return to original volumes (P < 0.01) for SEPT7KD samples. Mean and SEM are displayed. AU, arbitrary unit.
Figure 3.
Figure 3.
Septins assemble on the cell cortex during cortical retraction. (a) DIC and fluorescence images of wild-type D10 cells immobilized on anti-CD44–coated glass and stained for SEPT7 before or after a shift to 100 mOsm hypotonic media. Under isotonic conditions, SEPT7 is enriched at the cortex diffusely or in small puncta. Bar, 10 µm. (inset) Under hypotonic conditions, septins aggregate into filaments and rings. Bar, 1 µm. (b) Quantification of septin distributions observed in a. (c) Though some SEPT7 circles are observed in cells under isotonic conditions, each cell contains a greater number of rings under hypotonic conditions. Error bars represent SEM. (b and c) Representative data from one of two independent experiments performed. (d) Live imaging of SEPT6-GFP–expressing cells shifted to hypotonic media. Within 30 s, SEPT6-GFP begins to aggregate on the cortex and soon assembles into cortical rings that sometimes resemble tubules. Bar, 10 µm. (e) 3D reconstruction of SEPT6-GFP rings 20 minutes after a shift to hypotonic media. Bar, 10 µm. (f) SEPT6-GFP aggregations colocalize with invaginations in the plasma membrane, as indicated by GPI-mCherry fluorescence. Insets show boxed areas in greater detail. Bars, 2 µm.
Figure 4.
Figure 4.
Septin aggregates are independent of ion transport. (a and b) Treatment with ion channel inhibitors charybdotoxin (Char.) and NPPB did not influence initial or maximum volume of control (Ctl.) or SEPT7KD cells in the flow cytometry osmotic swelling assay, but both drugs significantly inhibited RVD. Data are pooled from three independent experiments. Error bars represent SD. AU, arbitrary unit. (c) Single-plane time-lapse images of SEPT6-GFP–expressing control cells or cells treated with charybdotoxin or NPPB demonstrate that swelling-induced septin assembly on the cortex can occur in the absence of volume recovery. The bottom row of images taken 20 min after a media change are 3D reconstructions of whole cells. Bar, 10 µm.
Figure 5.
Figure 5.
Interplay between septins and the actomyosin cytoskeleton in cell shrinkage. (a) Treatment with inhibitors of MyoII (blebbistatin), actin polymerization (latrunculin B), or microtubule polymerization (nocodazole) does not influence initial or maximum cell size in the flow cytometry osmotic swelling assay. AU, arbitrary unit. (b) Cortical retraction in this assay is slowed by blebbistatin or latrunculin but unaffected by nocodazole. (a and b) n = 7. (c) There is no additive or synergistic effect on cortical retraction of latrunculin B (Lat B) treatment of SEPT7KD cells. Lines indicate the groups between which statistical posttests were performed after analysis of variance. n = 5. (a–c) Error bars represent SD. (d and e) Illustration and quantification of anti-SEPT7 staining of wild-type cells showing that formation of septin filaments (white arrowheads) and rings (red arrowheads) is normal in cells treated with blebbistatin (pooled data from two independent experiments). Insets in d show septin rings in the boxed areas. Hypo, hypotonic; Iso, isotonic. (f) Imaging of SEPT6-GFP–expressing cells demonstrates septin aggregation into rings with latrunculin B treatment under isotonic conditions, whereas no such aggregation was observed with jasplakinolide (Jasp.) treatment. The inset shows latrunculin B–induced septin rings in greater detail. (g) Confocal imaging of cells expressing SEPT6-GFP and LifeAct-Ruby showing actin ruffles with subsequent recruitment of SEPT6-GFP to their bases. Bars, 10 µm.
Figure 6.
Figure 6.
Septins recapture excess membrane. (a) Side scatter measurements of control and SEPT7KD D10 cells in the flow cytometry osmotic swelling assay, demonstrating that scattering drops upon the shift to hypotonic media and then gradually returns to isotonic levels. SEPT7KD cells are inhibited in their return to normal side scatter values. The graph shows two samples each of control and SEPT7KD cells. (b) Summary of data from three independent experiments showing a significant decrease in the rate of side scatter recovery in SEPT7KD cells. Error bars represent SD. AU, arbitrary unit. (c) Relative GFP fluorescence along the perimeter of dynasore-treated cells during normal crawling (top) or during blebbing (bottom), accompanied by sample confocal micrographs from which such measurements were taken. Cell perimeters for analysis were generated by manually tracing the outline of the cell in a corresponding DIC image. The gray line in each graph indicates the mean relative intensity at that point. n = 9 in each group. Bars, 10 µm. (d) Time-lapse imaging of SEPT6-GFP–expressing cells treated with dynasore demonstrates recruitment of SEPT6-GFP to an individual bleb concurrent with retraction. The red line indicates the outline of the cell. Bar, 2 µm. (e) Time-lapse images of a dynasore-treated cell demonstrating the appearance of LifeAct-Ruby on a bleb followed by population of that bleb with SEPT6-GFP. Bar, 10 µm.

References

    1. Bertin A., McMurray M.A., Thai L., Garcia G., III, Votin V., Grob P., Allyn T., Thorner J., Nogales E. 2010. Phosphatidylinositol-4,5-bisphosphate promotes budding yeast septin filament assembly and organization. J. Mol. Biol. 404:711–731 10.1016/j.jmb.2010.10.002 - DOI - PMC - PubMed
    1. Blaser H., Reichman-Fried M., Castanon I., Dumstrei K., Marlow F.L., Kawakami K., Solnica-Krezel L., Heisenberg C.-P., Raz E. 2006. Migration of zebrafish primordial germ cells: A role for myosin contraction and cytoplasmic flow. Dev. Cell. 11:613–627 10.1016/j.devcel.2006.09.023 - DOI - PubMed
    1. Carton I., Hermans D., Eggermont J. 2003. Hypotonicity induces membrane protrusions and actin remodeling via activation of small GTPases Rac and Cdc42 in Rat-1 fibroblasts. Am. J. Physiol. Cell Physiol. 285:C935–C944 - PubMed
    1. Chacko A.D., Hyland P.L., McDade S.S., Hamilton P.W., Russell S.H., Hall P.A. 2005. SEPT9_v4 expression induces morphological change, increased motility and disturbed polarity. J. Pathol. 206:458–465 10.1002/path.1794 - DOI - PubMed
    1. Charras G.T., Hu C.-K., Coughlin M., Mitchison T.J. 2006. Reassembly of contractile actin cortex in cell blebs. J. Cell Biol. 175:477–490 10.1083/jcb.200602085 - DOI - PMC - PubMed

Publication types