. 2012 Jan 9;196(1):147-62.
doi: 10.1083/jcb.201102085.

A novel function for Cyclin A2: control of cell invasion via RhoA signaling

Affiliations

A novel function for Cyclin A2: control of cell invasion via RhoA signaling

Nikola Arsic et al. J Cell Biol. .

Abstract

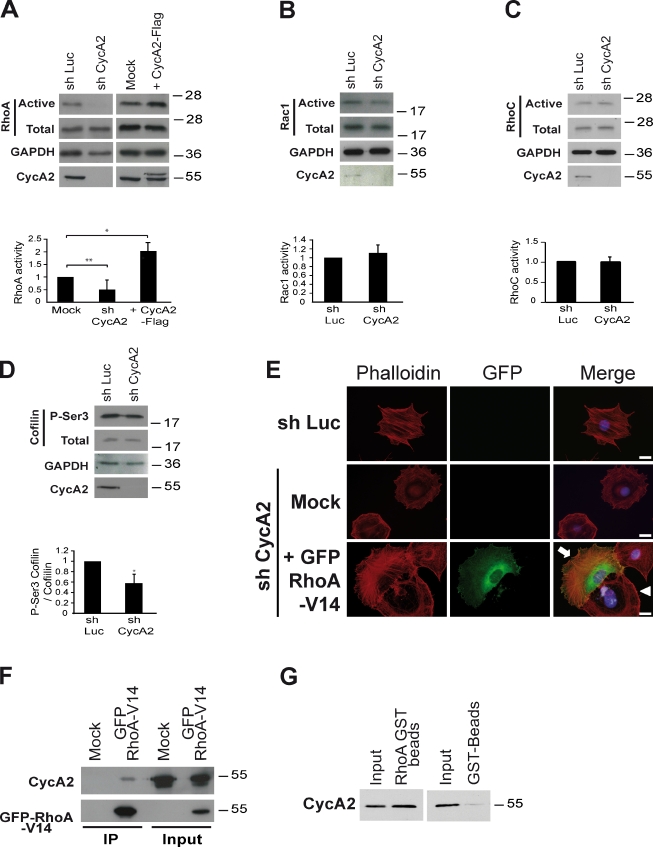
Cyclin A2 plays a key role in cell cycle regulation. It is essential in embryonic cells and in the hematopoietic lineage yet dispensable in fibroblasts. In this paper, we demonstrate that Cyclin A2-depleted cells display a cortical distribution of actin filaments and increased migration. These defects are rescued by restoration of wild-type Cyclin A2, which directly interacts with RhoA, or by a Cyclin A2 mutant unable to associate with Cdk. In vitro, Cyclin A2 potentiates the exchange activity of a RhoA-specific guanine nucleotide exchange factor. Consistent with this, Cyclin A2 depletion enhances migration of fibroblasts and invasiveness of transformed cells via down-regulation of RhoA activity. Moreover, Cyclin A2 expression is lower in metastases relative to primary colon adenocarcinoma in matched human tumors. All together, these data show that Cyclin A2 negatively controls cell motility by promoting RhoA activation, thus demonstrating a novel Cyclin A2 function in cytoskeletal rearrangements and cell migration.


Figures

Figure 1.
Figure 1.
Depletion of Cyclin A2 in NIH3T3 cells induces an accumulation of the cells in G2/M and a reorganization of Actin cytoskeleton and focal adhesion distribution. (A) Western blot analysis of Cyclin A2 depletion performed in noninfected, mock-infected cells (shLuc), or cells infected with a virus expressing an shRNA targeting Cyclin A2 (shCycA2). GAPDH is used as a loading control. Molecular markers are given in kilodaltons. (B) Cell cycle distribution of shLuc and shCycA2 NIH3T3 cells after release from a synchronization block. (C and E) Staining of F-Actin with phalloidin-rhodamine (red) and Vinculin (green) in NIH3T3 cells infected with shLuc or shCycA2 (C) or treated with the Cdk1 inhibitor RO 3306 or DMSO as a control (E). (insets) Fields with lower magnification. Bars, 20 µm. (D) FACS analysis of cell cycle distribution of NIH3T3 cells treated with RO 3306 (Cdk1 inhibitor) or DMSO as a control. Data are represented as means ± SEM (n = 3). PI, propidium iodide.
Figure 2.
Figure 2.
Reintroduction of both WT and Mut2–Cyclin A2 reverses F-Actin corticalization induced by Cyclin A2 depletion. (A) Schematic representation of mouse Cyclin A2 protein and modifications induced in this study. Mut1 and Mut2 show substitution of amino acid residues N171 or M200, L204, and W207, respectively, into alanines by site-directed mutagenesis. All constructs were C-terminally fused to three Flag tags. When required, nuclear localization (NLS) or nuclear export (NES) signals were introduced between the Cyclin A2 coding sequence and the Flag tags. The position of the shRNA sequence leading to undetectable levels of Cyclin A2 is indicated. (B) Analysis of binding and kinase-activating properties of Cyclin A2 mutants. Immunoprecipitation (IP) using anti-Flag–agarose affinity gel was performed on NIH3T3 cells extracts after transfection by WT–, Mut1–, or Mut2–Cyclin A2. Immune complexes were either submitted to Western blotting to identify binding partners or analyzed for their histone H1 kinase activity. Molecular markers are given in kilodaltons. (C) Cell cycle distribution of control and Cyclin A2–deficient cells infected with virus expressing wild-type (WT) and mutant Cyclin A2 (Mut2). Synchronized cells were analyzed 24 h after release from the proliferation block. Data are represented as means ± SEM (n = 3). (D) Immunofluorescence analysis of F-Actin organization of shCycA2 NIH3T3 cells transfected with plasmids encoding WT, Mut2, or Mut2 with NLS (Mut2-NLS) Cyclin A2 fused to a Flag tag. F-Actin was stained as in Fig. 1. Transfected Cyclin A2 proteins were detected with the anti-Flag antibody. Bars, 20 µm. The graph refers to the percentage of transfected cells harboring a reversion of the cortical phenotype (150–200 cells were scored for each case). Data are represented as means ± SEM (**, P = 0.0056; n = 4).
Figure 3.
Figure 3.
Rearrangement of Actin cytoskeleton upon Cyclin A2 depletion is independent of Cdk1 and Cdk2 activities. (A) F-Actin (red) and Cyclin A2 (green) staining by phalloidin or anti-Flag antibody of Cdk2−/− cells treated with the Cdk1 inhibitor RO 3306. Cdk2−/− cells were infected with CycA2 shRNA and transfected with wild-type (WT) Cyclin A2. Bars, 20 µm. (B) FACS analysis of cell cycle distribution after treatment of Cdk2−/− cells with RO 3306 for 24 h. Data are represented as means ± SEM (n = 3). (C) Western blot analysis of Cdk2 and Cyclin A2 after infection with CycA2 shRNA in Cdk2−/− cells. GAPDH is used as a loading control. Molecular markers are given in kilodaltons.
Figure 4.
Figure 4.
Cyclin A2 directly interacts with RhoA and regulates its activation state. (A–C, top) Western blotting after pull-down of activated forms of RhoA (A), Rac1 (B), or RhoC (C) after depletion (A, left–C) or forced expression (A, right) of Cyclin A2. (bottom) Corresponding quantifications from independent pull-down experiments (normalization of the GTP-bound forms to total RhoA, Rac1, or RhoC and GAPDH). Data are represented as means ± SEM (*, P = 0.031; **, P = 0.003; n = 5 for shCycA2, n = 3 for CycA2-Flag for the RhoA pull-down assay, and n = 3 for the Rac1 and RhoC pull-down assays). (D) Western blot analysis (top) and quantification (bottom) of the phosphorylation state of the RhoA–ROCK effector Cofilin (±SEM; *, P = 0.031; n = 3). (E) Detection of the rescue of cytoskeleton corticalization by constitutively active RhoA (green) in Cyclin A2–depleted cells using F-Actin staining (red). The arrow points to a RhoA-expressing cell, and the arrowhead points to a nontransfected cell. Bars, 20 µm (F) Coimmunoprecipitation (IP) of endogenous Cyclin A2 with RhoA. Cell lysates obtained from NIH3T3 cells transfected with RhoAV14-GFP were immunoprecipitated by GFP-Trap beads. Interaction between the two molecules was detected after blotting with an anti–Cyclin A2 antibody after GFP pull-down. (G) Cyclin A2 directly interacts with RhoA. Recombinant Cyclin A2 was incubated either with glutathione beads as control or RhoA-GST bound to glutathione beads. Cyclin A2 bound to RhoA-GST was detected by Western blotting after elution. Molecular markers are given in kilodaltons.
Figure 5.
Figure 5.
The N-terminal domain of Cyclin A2 mediates its interaction with RhoA and restores cytoplasmic bundles in Cyclin A2–deficient cells. (A) Schematic representation of Cyclin A2 deletion mutants. The first one encompasses the N-terminal part of Cyclin A2 upstream of the Cyclin box (N-ter). The second contains the C-terminal part of the protein including the Cyclin box (C-ter). The latter construct contains amino acids 1–7, allowing proper expression of the protein. Flag tag was fused to the C-terminal part of each fragment. (B) Interaction of RhoA with Cyclin A2 fragments. Immunoprecipitations (IP) using anti-Flag–agarose affinity gel were performed on NIH3T3 cells cotransfected with plasmids encoding RhoA-EGFP and N-terminal, C-terminal, or full-length Cyclin A2. Binding of RhoA to the different fragments was detected by immunoblotting using anti-GFP antibodies. Molecular markers are given in kilodaltons. (C) Cyclin A2 fragments were expressed in Cyclin A2–deficient NIH3T3 cells and detected by immunofluorescence using anti-Flag antibody (green), whereas F-Actin was detected using phalloidin staining (red). Bars, 20 µm. Graph refers to the percentage of transfected cells harboring a reversion of the cortical phenotype. Data are represented as means ± SEM (**, P = 0.006; n = 3).
Figure 6.
Figure 6.
Cyclin A2 potentiates RhoA GEF exchange activity. (A) Interaction of Cyclin A2 with either nucleotide-free GST RhoA or GST RhoA loaded, respectively, with GDP or GTP (left) and quantification of retained Cyclin A2 (right). Molecular markers are given in kilodaltons. (B–G) Kinetics of Mant-GTP loading by Dbl (B) and Tgat (D). Results are expressed as fluorescence units versus time. The reactions performed in the absence of GEFs and with irrelevant proteins (MBP or GST) reflect the spontaneous exchange activity of RhoA. In F and G, the N- and C-terminal halves as well as Cyclin E1 are included in the assay. C, E, and G represent a normalized quantitative analysis of the initial velocity measured in six independent experiments (B and C) and three independent experiments (D–G). Data are represented as means ± SEM (*, P = 0.03; **, P = 0.0081). WB, Western blot; N-ter, N-terminal; C-ter, C-terminal.
Figure 7.
Figure 7.
Cyclin A2 modulates cell migration and invasion. (A) Wound-healing migration assay performed on confluent NIH3T3 cells infected with shLuc or shCycA2. Pictures were taken at the time of scratch (t = 0) and 4 and 12 h afterward. Migration velocities were calculated after time-lapse acquisitions for 22 h and normalized with shLuc condition. (*, P > 0.05; n = 3). Black dotted lines indicate scratch limits. Bar, 200 µm. (B) Representative microscope fields of insert membranes after a Boyden chamber migration assay and quantification of the stained cells (P = 0.0007; n = 3). Bar, 100 µm. ***, P = 0.0001. (C and D) Cell invasion in 3D collagen matrix for NIH3T3 and NIH3T3-RasV12 cells (C; *, P = 0.01; n = 6) and MDA-MB-231 cells after depletion or forced expression of Cyclin A2 (D; *, P = 0.015; **, P = 0.0043; n = 6). Invasion ratios were relative to either shLuc-treated cells (C) or to cells infected with empty virus (D). Data are means ± SEM.
Figure 8.
Figure 8.
Cyclin A2 is differentially expressed in primary human tumors versus metastases. (A and B) Cyclin A2 quantification in SW480 and SW620 cells (A; *, P = 0.031) or matched human primary colorectal tumors (T) and their corresponding metastases (M) from 12 individuals (B; ****, P > 0.0001). Identical amounts of protein extracts were loaded. Data are means ± SEM. (C) Three representative examples of immunohistological Cyclin A2 staining in primary colorectal tumors (middle) and their metastases (bottom) versus normal tissue (top). (inset) Enlargement of the indicated region shows cytoplasmic Cyclin A2 staining. Bars, 100 µm. (D) Quantification was performed on eight matched samples (**, P = 0.0055). Molecular markers are given in kilodaltons. Bars (whiskers) represent maximum and minimum values; the white line corresponds to the median.

Comment in

Similar articles

Cited by

References

    1. Aaltomaa S., Lipponen P., Ala-Opas M., Eskelinen M., Syrjänen K., Kosma V.M. 1999. Expression of cyclins A and D and p21(waf1/cip1) proteins in renal cell cancer and their relation to clinicopathological variables and patient survival. Br. J. Cancer. 80:2001–2007 10.1038/sj.bjc.6690634 - DOI - PMC - PubMed
    1. Bergmann-Leitner E.S., Abrams S.I. 2000. Differential role of Fas/Fas ligand interactions in cytolysis of primary and metastatic colon carcinoma cell lines by human antigen-specific CD8+ CTL. J. Immunol. 164:4941–4954 - PubMed
    1. Besson A., Gurian-West M., Schmidt A., Hall A., Roberts J.M. 2004. p27Kip1 modulates cell migration through the regulation of RhoA activation. Genes Dev. 18:862–876 10.1101/gad.1185504 - DOI - PMC - PubMed
    1. Bondi J., Husdal A., Bukholm G., Nesland J.M., Bakka A., Bukholm I.R. 2005. Expression and gene amplification of primary (A, B1, D1, D3, and E) and secondary (C and H) cyclins in colon adenocarcinomas and correlation with patient outcome. J. Clin. Pathol. 58:509–514 10.1136/jcp.2004.020347 - DOI - PMC - PubMed
    1. Borm B., Requardt R.P., Herzog V., Kirfel G. 2005. Membrane ruffles in cell migration: indicators of inefficient lamellipodia adhesion and compartments of actin filament reorganization. Exp. Cell Res. 302:83–95 10.1016/j.yexcr.2004.08.034 - DOI - PubMed

Publication types

MeSH terms