. 2012 Mar 15;442(3):649-59.
doi: 10.1042/BJ20111700.

Protein kinase D2 has a restricted but critical role in T-cell antigen receptor signalling in mature T-cells

Affiliations

Protein kinase D2 has a restricted but critical role in T-cell antigen receptor signalling in mature T-cells

Maria N Navarro et al. Biochem J. .

Abstract

PKD (protein kinase D) 2 is a serine/threonine kinase activated by diacylglycerol in response to engagement of antigen receptors in lymphocytes. To explore PKD2 regulation and function in TCR (T-cell antigen receptor) signal transduction we expressed TCR complexes with fixed affinity for self antigens in the T-cells of PKD2-null mice or mice deficient in PKD2 catalytic activity. We also developed a single cell assay to quantify PKD2 activation as T-cells respond to developmental stimuli or engagement of α/β TCR complexes in vivo. Strikingly, PKD2 loss caused increases in thymic output, lymphadenopathy and splenomegaly in TCR transgenic mice. The precise magnitude and timing of PKD2 activation during T-cell development is thus critical to regulate thymic homoeostasis. PKD2-null T-cells that exit the thymus have a normal transcriptome, but show a limited and abnormal transcriptional response to antigen. Transcriptional profiling reveals the full consequences of PKD2 loss and maps in detail the selective, but critical, function for PKD2 in signalling by α/β mature TCR complexes in peripheral T-cells.


Figures

Figure 1
Figure 1. PKD2 regulates thymic output
The data show the number of T-cells in different tissues obtained from wild-type (PKD2+/+) or PKD2-null mice (PKD2−/−) backcrossed to different TCR transgenic mice, as an averaged value±S.E.M. (a) Total thymocytes in P14 and OTI wild-type or PKD2-null mice (PKD2−/−) (n=7–14 mice). (b) DP thymocytes in P14 and OTI wild-type or PKD2-null mice (PKD2−/−) (n=7–14 mice). (c) SP thymocytes (CD8+SP) in P14 and OTI wild-type or PKD2-null mice (PKD2−/−) (n=7–14 mice). (d) Naïve T-cells in pooled lymph nodes in P14 and OTI wild-type or PKD2-null mice (PKD2−/−) (n=3–12). (e) Images depict spleens (upper panel) and mesenteric lymph nodes (lower panel) from age- and sex-matched OTI wild-type and PKD2-null mice (PKD2−/−), representative of 7 experiments. (f) DP thymocytes from OTII wild-type and PKD2-null mice (PKD2−/−) (n=5). (g) DP thymocytes, naïve T-cells in spleens and pooled lymph nodes from OTI wild-type and PKD2SSAA/SSAA mutant (n=3–7).
Figure 2
Figure 2. Microarray analysis of P14 PKD2-null T-cells
(a) The data show flow cytometric analysis of the expression of the different surface markers in P14 wild-type and P14xPKD2−/− naïve T-cells, and are representative of three independent experiments. The data in (b), (c) and (d) show gene expression profiles of lymph node cells from P14 and P14 PKD2-null mice unstimulated or stimulated for 4 h with LCMV gp33 peptide (TCR triggering) obtained from microarray analysis of the different samples. Data are presented as the distribution of the intensity ratio (log2-fold change) plotted by the average of the normalized intensity values for probes identified as being present in at least one sample; black dots indicate probes with a significant change (P<0.05) of 2-fold or greater, and grey dots indicate probes with no significant change or a change below 2-fold. Data are representative of a single microarray analysis performed with triplicate samples. (b) Comparison of gene expression profiles of untreated lymph node cells of P14 PKD2-null (PKD2−/−) relative to P14 wild-type. Lines within the graph indicate probes corresponding to the PKD2 gene (Prkd2). (c) Comparison of gene expression profiles of P14 wild-type TCR triggered relative to P14 wild-type untreated samples. (d) Comparison of gene expression profiles of P14 PKD2-null (PKD2−/−) TCR triggered relative to untreated P14 PKD2-null (PKD2−/−) samples.
Figure 3
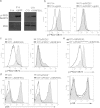
Figure 3. Single cell analysis of PKD2 phosphorylation in naïve T cells
(a) Western blot analysis of PKD2 phosphorylation in lymph node cells from P14 (left-hand panels) and OTI (right-hand panels) TCR transgenic mice unstimulated or stimulated with specific peptides (gp33 or SIINFEKL respectively) for 30 min, assessed using phospho-PKD2 Ser873 and pan PKD antisera. Western blot are representative of at least five experiments. In (b), (c), (d) and (e), data show the level of PKD2 or S6 phosphorylation in unstimulated or TCR-stimulated T-cells cultured for 4 h with specific peptide (gp33 for P14-TCR and SIINFEKL for OTI-TCR), assessed by flow cytometric analysis of intracellular staining with anti-phospho-PKD2 Ser873. (b) Histograms compare the level of PKD2 phosphorylation in unstimulated or TCR-stimulated cells in P14 wild-type (left-hand panel) and P14×PKD2−/− (right-hand panel). Representative of two experiments. (c and d) Histograms compare the level of PKD2 phosphorylation (c) and S6 phosphorylation (d) in unstimulated or TCR-stimulated OTI wild-type (left-hand panels) and OTIxPKD2−/− (right-hand panels) cells. Representative of four experiments. (e) Histograms compare the level of PKD2 phosphorylation (upper panel) and S6 phosphorylation (lower panel) in unstimulated or TCR-stimulated OTI wild-type and PKD2 SSAA/SSAA cells. Representative of two experiments. P, phospho-.
Figure 4
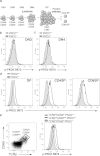
Figure 4. Single cell analysis of PKD2 phosphorylation during thymus development
(a) Schematic representation of T-cell development. In (b), (c), (d) and (e), the data show the level of PKD2 phosphorylation in the different thymocyte subsets assessed by flow cytometric analysis of intracellular staining with anti-phospho-PKD2 Ser873. PKD2−/− subpopulations were used as controls for background staining. Histograms are representative of four independent experiments. (b) Histogram shows the level of PKD2 phosphorylation in DN3 thymocytes. (c) Histogram shows the level of PKD2 phosphorylation in DN4 thymocytes. (d) Histograms show levels of PKD2 phosphorylation in DP, CD4SP and CD8SP thymocytes. (e) Histogram shows the level of PKD2 phosphorylation in pre-selected (TCRβintCD69low) and post-selected (TCRβhiCD69hi) thymocytes. Populations were electronically gated as depicted in the dot plot.
Figure 5
Figure 5. Role of PKD2 in thymus development of TCR transgenic mice
(a) The data show the level of PKD2 phosphorylation in the DN thymocyte subset of non-TCR transgenic (Non-TCR-Tg), OTI, P14 and OTII TCR transgenic mice, assessed by flow cytometric analysis of intracellular staining with anti-phospho-PKD2 Ser873. PKD2−/− subpopulations were used as controls for background staining. Histograms are representative of three experiments. (b) Number of DP cells generated after co-culture of DN thymocytes from non-TCR transgenic wild-type (PKD2+/+) and PKD2-null (PKD2−/−) mice with OP9-DL1 stroma. Numbers are an averaged value of three independent experiments±S.E.M. (c) Number of DP cells generated after co-culture of DN thymocytes from non-TCR transgenic (Non-TCR-Tg) and P14 TCR transgenic (TCR-Tg) mice with OP9-DL1 stroma. Representative of two experiments performed in parallel. (d) The data show the number of DP cells generated after co-culture of DN thymocytes from different TCR transgenic mice with OP9-DL1 stroma. Left-hand panel, thymocytes from P14 wild-type and PKD2-null (PKD2−/−) mice. Numbers are an averaged value of three independent experiments±S.E.M. Middle panel, thymocytes from OTI wild-type and PKD2-null (PKD2−/−) mice. Representative of two experiments. Right-hand panel, thymocytes from OTI wild-type and PKD2 S707A/S711A mutant (PKD2SSAA/SSAA) mice. Representative of two experiments. (e) Percentage of DP cells in E15 fetal thymic lobes from OTI wild-type or PKD2-null (PKD2−/−) mice cultured in vitro, as an averaged value±S.E.M. (n=4 experiments). (f) Histograms show flow cytometric analysis of DNA content in ex vivo isolated DN thymocytes from non-TCR transgenic (Non-TCR-Tg), P14 wild-type (P14) and P14 PKD2-null (P14xPKD2−/−) mice. Numbers within histograms represent the percentages of cells in S/G2-phase. (g) Number of DP cells generated after co-culture of DN thymocytes from P14 PKD2-null (PKD2−/−) mice infected with a retroviral vector encoding either GFP alone or GFP–PKDcat with OP9-DL1 stroma. Graph shows number of GFP+ DP cells and is representative of three independent experiments. (h) Histograms show flow cytometric analysis DNA content of DN thymocytes from P14 PKD2-null (PKD2−/−) mice infected with a retroviral vector encoding either GFP alone or GFP–PKDcat after 4 days of co-culture with OP9-DL1 stroma. Numbers within histograms represent the percentages of cells in S/G2-phase.

References

    1. Salmond R. J., Filby A., Qureshi I., Caserta S., Zamoyska R. T-cell receptor proximal signaling via the Src-family kinases, Lck and Fyn, influences T-cell activation, differentiation, and tolerance. Immunol. Rev. 2009;228:9–22. - PubMed
    1. Matthews S. A., Cantrell D. A. New insights into the regulation and function of serine/threonine kinases in T lymphocytes. Immunol. Rev. 2009;228:241–252. - PMC - PubMed
    1. Guo R., Wan C. K., Carpenter J. H., Mousallem T., Boustany R. M., Kuan C. T., Burks A. W., Zhong X. P. Synergistic control of T cell development and tumor suppression by diacylglycerol kinase α and ζ. Proc. Natl. Acad. Sci. U.S.A. 2008;105:11909–11914. - PMC - PubMed
    1. Olenchock B. A., Guo R., Carpenter J. H., Jordan M., Topham M. K., Koretzky G. A., Zhong X. P. Disruption of diacylglycerol metabolism impairs the induction of T cell anergy. Nat. Immunol. 2006;7:1174–1181. - PubMed
    1. Riese M. J., Grewal J., Das J., Zou T., Patil V., Chakraborty A. K., Koretzky G. A. Decreased diacylglycerol metabolism enhances ERK activation and augments CD8+ T cell functional responses. J. Biol. Chem. 2011;286:5254–5265. - PMC - PubMed

Publication types

Substances

Associated data