. 2012 Jan 10:13:12.
doi: 10.1186/1471-2164-13-12.

A searchable cross-platform gene expression database reveals connections between drug treatments and disease

Affiliations

A searchable cross-platform gene expression database reveals connections between drug treatments and disease

Gareth Williams. BMC Genomics. .

Abstract

Background: Transcriptional data covering multiple platforms and species is collected and processed into a searchable platform independent expression database (SPIED). SPIED consists of over 100,000 expression fold profiles defined independently of control/treatment assignment and mapped to non-redundant gene lists. The database is thus searchable with query profiles defined over genes alone. The motivation behind SPIED is that transcriptional profiles can be quantitatively compared and ranked and thus serve as effective surrogates for comparing the underlying biological states across multiple experiments.

Results: Drug perturbation, cancer and neurodegenerative disease derived transcriptional profiles are shown to be effective descriptors of the underlying biology as they return related drugs and pathologies from SPIED. In the case of Alzheimer's disease there is high transcriptional overlap with other neurodegenerative conditions and rodent models of neurodegeneration and nerve injury. Combining the query signature with correlating profiles allows for the definition of a tight neurodegeneration signature that successfully highlights many neuroprotective drugs in the Broad connectivity map.

Conclusions: Quantitative querying of expression data from across the totality of deposited experiments is an effective way of discovering connections between different biological systems and in particular that between drug action and biological disease state. Examples in cancer and neurodegenerative conditions validate the utility of SPIED.


Figures

Figure 1
Figure 1
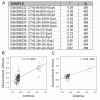
High scoring correlations in the SPIED with queries derived from the CMAP profiles of rapamycin, LY-294002 and wortmannin are with a pI3 kinase inhibitor GDS-0941. The individual sample scores and the regression scores (in this and later Figures/Tables r is the Pearson correlation coefficient and N is the number of genes in the given correlation) with the treatment and control groups are shown in A. The pooled profiles are defined by the ratios of the treatment to control averages. The fold regression plots are given in B, C and D.
Figure 2
Figure 2
The CMAP rapamycin query score highly against a glucocorticoid treatment experiment. The correlations with the individual samples are shown in A and the regression plots for the pooled treatment and control groups are shown at 24 hours in B and at 6 hours in C.
Figure 3
Figure 3
The rapamycin CMAP significantly anti-correlates with the transcriptional changes induced in chord blood cells by two distinct BCR fusion transformations. The correlations with the individual samples is shown in A and the negative regression with the pooled BCR/ABL1 transform v control and BCR/FGFR1 transform v control are shown in B and C respectively.
Figure 4
Figure 4
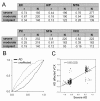
Enrichment plots for high scoring SPIED hits against the glucocorticoid (dexamethasone) resistant v sensitive profile query. The dexamethasone resistance query scores highly against a corticosteroid (prednisolone) resistance study. The enrichment plot is shown in A. Ordering the samples according to correlation score with the query profile the enrichment plot is the cumulative fraction of the given phenotype in the given sample fraction. Explicitly, if there are N correlation score ordered samples and two phenotypes defined by qi = ± 1 with i = 1,...,N, then the enrichment for the phenotypes is ek+-=±i=1kqii=1Nqiand the enrichment plot is just ek+-against kN. The plot shows that sensitive samples are enriched for lower correlation scores and resistant samples are enriched for higher correlation scores. The enrichment plots for the lung cancer study is shown in B and for the pancreatic cancer study in C.
Figure 5
Figure 5
A severe AD query is highly correlated with another AD transcription profiling study in SPIED. The regression scores across six brain regions are shown in A. All apart from HIP are highly correlated with the severe AD profile. The overall enrichment for positive query correlation is shown in B (see Figure 4 legend for definition of enrichment plot) and a particular brain region regression plot is illustrated in C.

References

    1. Barrett T, Troup DB, Wilhite SE, Ledoux P, Rudnev D, Evangelista C, Kim IF, Soboleva A, Tomashevsky M, Edgar R. NCBI GEO: mining tens of millions of expression profiles--database and tools update. Nucleic Acids Res. 2007. pp. D760–765. - PMC - PubMed
    1. Parkinson H, Sarkans U, Kolesnikov N, Abeygunawardena N, Burdett T, Dylag M, Emam I, Farne A, Hastings E, Holloway E, ArrayExpress update--an archive of microarray and high-throughput sequencing-based functional genomics experiments. Nucleic Acids Res. 2011. pp. D1002–1004. - PMC - PubMed
    1. Cui X, Churchill GA. Statistical tests for differential expression in cDNA microarray experiments. Genome Biol. 2003;4(4):210. doi: 10.1186/gb-2003-4-4-210. - DOI - PMC - PubMed
    1. Subramanian A, Tamayo P, Mootha VK, Mukherjee S, Ebert BL, Gillette MA, Paulovich A, Pomeroy SL, Golub TR, Lander ES. et al.Gene set enrichment analysis: a knowledge-based approach for interpreting genome-wide expression profiles. Proc Natl Acad Sci USA. 2005;102(43):15545–15550. doi: 10.1073/pnas.0506580102. - DOI - PMC - PubMed
    1. Stark C, Breitkreutz BJ, Reguly T, Boucher L, Breitkreutz A, Tyers M. BioGRID: a general repository for interaction datasets. Nucleic Acids Res. 2006. pp. D535–539. - PMC - PubMed

Publication types

MeSH terms

Substances

LinkOut - more resources