. 2012 Feb;61(2):531-41.
doi: 10.2337/db11-1034. Epub 2012 Jan 10.

A genome-wide association study of gestational diabetes mellitus in Korean women

Affiliations

A genome-wide association study of gestational diabetes mellitus in Korean women

Soo Heon Kwak et al. Diabetes. 2012 Feb.

Abstract

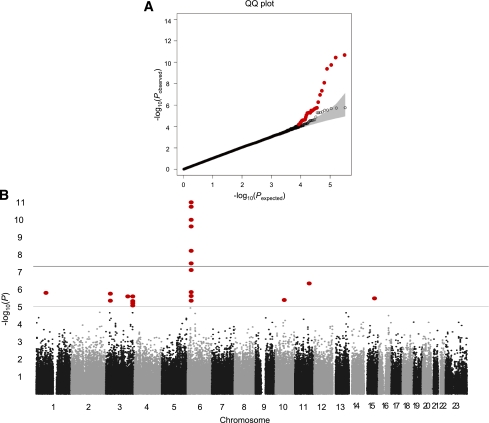
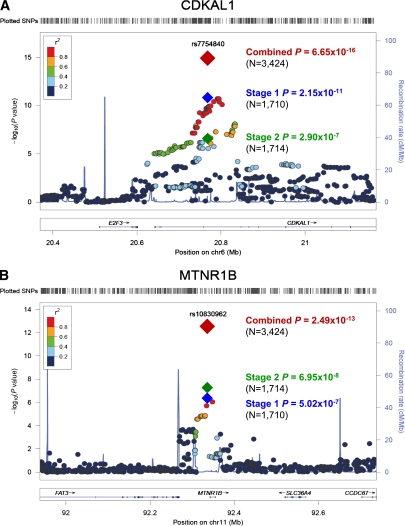
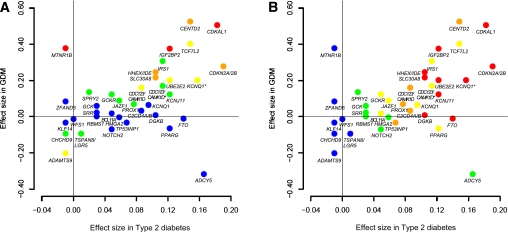
Knowledge regarding the genetic risk loci for gestational diabetes mellitus (GDM) is still limited. In this study, we performed a two-stage genome-wide association analysis in Korean women. In the stage 1 genome scan, 468 women with GDM and 1,242 nondiabetic control women were compared using 2.19 million genotyped or imputed markers. We selected 11 loci for further genotyping in stage 2 samples of 931 case and 783 control subjects. The joint effect of stage 1 plus stage 2 studies was analyzed by meta-analysis. We also investigated the effect of known type 2 diabetes variants in GDM. Two loci known to be associated with type 2 diabetes had a genome-wide significant association with GDM in the joint analysis. rs7754840, a variant in CDKAL1, had the strongest association with GDM (odds ratio 1.518; P=6.65×10(-16)). A variant near MTNR1B, rs10830962, was also significantly associated with the risk of GDM (1.454; P=2.49×10(-13)). We found that there is an excess of association between known type 2 diabetes variants and GDM above what is expected under the null hypothesis. In conclusion, we have confirmed that genetic variants in CDKAL1 and near MTNR1B are strongly associated with GDM in Korean women. There seems to be a shared genetic basis between GDM and type 2 diabetes.


Figures

FIG. 1.
FIG. 1.
Stage 1 genome scan results. A: QQ plot showing the distribution of the observed P values from the logistic regression analysis for the stage 1 genome scan against the expected distribution under the null hypothesis. The gray zone indicates the 95% CI. Colored circle, distribution of excess association signals driven by the known type 2 diabetes variants (listed in Table 4) and markers in LD (r2 > 0.8) with them. ○, distribution after excluding the known type 2 diabetes variants. B: Manhattan plot depicting the significance of all the association results of the stage 1 genome scan. SNP locations are plotted on the x-axis according to their chromosomal position. The negative log10 of P values derived from the logistic regression analysis under the additive model are plotted on the y-axis. (A high-quality color representation of this figure is available in the online issue.)
FIG. 2.
FIG. 2.
Dense regional association plot near CDKAL1 (A) and MTNR1B (B). The hash marks above the panel represent the position of each SNP that was genotyped or imputed. The negative log10 of P values from logistic regression are shown in the panel. The blue diamond indicates the SNP with the most significant association in the stage 1 genome scan. The green and red diamonds represent the results of the SNP in stage 2 and joint stage 1 plus stage 2 analysis, respectively. Their corresponding P values are indicated on the right. Estimated recombination rates are plotted to reflect recombination hot spots. The SNPs in LD with the most significant SNP are color coded to represent their strength of LD. The locations of genes, exons and introns are shown in the lower panel (taken from the Human Genome hg18 build). (A high-quality color representation of this figure is available in the online issue.)
FIG. 3.
FIG. 3.
QQ plot of the association between known type 2 diabetes variants and GDM. Comparison of the effect size of known type 2 diabetes variants in GDM and type 2 diabetes. The gray zone indicates the 95% CI. The known type 2 diabetes variants tested for association are listed in Table 4.
FIG. 4.
FIG. 4.
Comparison of the effect size of known type 2 diabetes variants in GDM and type 2 diabetes. Effect size (β-coefficient from logistic regression analysis) of the known type 2 diabetes variants in GDM (y-axis) and type 2 diabetes (x-axis) are plotted with their corresponding P values (A: P values in GDM; B: P values in type 2 diabetes): red, P < 0.0001; orange, 0.0001 ≤ P < 0.01; yellow, 0.01 ≤ P < 0.10; green, 0.10 ≤ P < 0.50; blue, 0.50 ≤ P. The β-coefficient for GDM was derived from our stage 1 genome scan and that for type 2 diabetes was derived from the AGEN type 2 diabetes study (26). The two CDC123/CAMK1D variants are distinguished by CDC123/CAMK1D for rs10906115 and CDC123/CAMK1D* for rs12779790. The two KCNQ1 variants are distinguished by KCNQ1 for rs231362 and KCNQ* for rs2237892. (A high-quality color representation of this figure is available in the online issue.)

Similar articles

Cited by

References

    1. Lander ES, Linton LM, Birren B, et al. ; International Human Genome Sequencing Consortium Initial sequencing and analysis of the human genome. Nature 2001;409:860–921 - PubMed
    1. Voight BF, Scott LJ, Steinthorsdottir V, et al. ; MAGIC Investigators; GIANT Consortium Twelve type 2 diabetes susceptibility loci identified through large-scale association analysis. Nat Genet 2010;42:579–589 - PMC - PubMed
    1. Dupuis J, Langenberg C, Prokopenko I, et al. ; DIAGRAM Consortium; GIANT Consortium; Global BPgen Consortium; Anders Hamsten on behalf of Procardis Consortium; MAGIC Investigators New genetic loci implicated in fasting glucose homeostasis and their impact on type 2 diabetes risk. Nat Genet 2010;42:105–116 - PMC - PubMed
    1. Yamauchi T, Hara K, Maeda S, et al. A genome-wide association study in the Japanese population identifies susceptibility loci for type 2 diabetes at UBE2E2 and C2CD4A-C2CD4B. Nat Genet 2010;42:864–868 - PubMed
    1. Tsai FJ, Yang CF, Chen CC, et al. A genome-wide association study identifies susceptibility variants for type 2 diabetes in Han Chinese. PLoS Genet 2010;6:e1000847. - PMC - PubMed

Publication types