. 2012 Jan 10;3(1):e00285-11.
doi: 10.1128/mBio.00285-11. Print 2012.

The novel sigma factor-like regulator RpoQ controls luminescence, chitinase activity, and motility in Vibrio fischeri

Affiliations

The novel sigma factor-like regulator RpoQ controls luminescence, chitinase activity, and motility in Vibrio fischeri

Xiaodan Cao et al. mBio. .

Abstract

Vibrio fischeri, the bacterial symbiont of the Hawaiian bobtail squid, Euprymna scolopes, uses quorum sensing to control genes involved in bioluminescence, host colonization, and other biological processes. Previous work has shown that AinS/R-directed quorum sensing also regulates the expression of rpoQ (VF_A1015), a gene annotated as an RpoS-like sigma factor. In this study, we demonstrate using phylogenetics that RpoQ is related to, but distinct from, the stationary-phase sigma factor RpoS. Overexpression of rpoQ results in elevated chitinase activity but decreased motility and luminescence, three activities associated with symbiosis. The reduction in bacterial luminescence associated with the overexpression of rpoQ occurs both in culture and within the light-emitting organ of the squid host. This suppression of bioluminescence is due to the repression of the luxICDABEG promoter. Our results highlight RpoQ as a novel regulatory component, embedded in the quorum-signaling network that controls several biological processes in V. fischeri.

Importance: Quorum signaling is a widely occurring phenomenon that functions in diverse bacterial taxa. It is most often found associated with species that interact with animal or plant hosts, either as mutualists or pathogens, and controls the expression of genes critical to tissue colonization. We present the discovery of rpoQ, which encodes a new regulatory component in the quorum-signaling pathway of Vibrio fischeri. RpoQ is a novel protein in the RpoS family of stationary-phase sigma factors. Unlike many other regulatory proteins involved in the quorum-signaling pathways of the Vibrionaceae, the distribution of RpoQ appears to be restricted to only two closely related species. The role of this regulator is to enhance some quorum-signaling outputs (motility) while suppressing others (luminescence). We propose that RpoQ may be a recently evolved or acquired component in V. fischeri that provides this organism with an additional level of regulation to modulate its existing quorum-signaling pathway.


Figures

FIG 1
FIG 1
Model of quorum-sensing systems in V. fischeri. When the levels of octanoyl homoserine lactone (C8; octagons) and AI-2 (pentagons) are low, AinR and the LuxP/Q complex phosphorylate LuxU. Phosphorylated LuxU, in turn, phosphorylates LuxO, which activates the expression of the small RNA (sRNA) Qrr1. Qrr1 destabilizes the mRNA encoding LitR. Conversely, when the level of C8 and AI-2 autoinducers is high, the signaling cascade is inactivated, resulting in stable LitR production. LitR transcriptionally activates luxR, which encodes the transcriptional regulator LuxR. In the presence of the accumulating autoinducer 3-oxo-hexanoyl homoserine lactone (3-oxo-C6; hexagons), LuxR activates several genes, including the luxCDABEG locus, which is responsible for luciferase production and activity. The dashed arrows indicate phosphoryl group transfers. The question mark indicates an unknown number of steps.
FIG 2
FIG 2
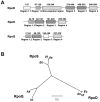
Structure and phylogeny of Rpo proteins. (A) Domain comparison between the V. fischeri RpoD, RpoS, and RpoQ proteins. Numbers above the conserved domains indicate amino acid positions. (B) Neighbor-joining phylogenetic analysis of RpoQ. Sequences spanning region 2 through region 4 were used to generate the phylogenetic tree with the PHYLIP software program. The tree was bootstrapped with 1,000 replicates, and all nodes were supported 100%. Abbreviations used are as follows: Vf, Vibrio fischeri; As, Aliivibrio salmonicida; Ec, Escherichia coli. The scale bar represents genetic distances in substitutions per residue.
FIG 3
FIG 3
qRT-PCR analysis of rpoQ expression in V. fischeri strains MJM1100 (wild type [WT]), TIM305 (ΔluxO), TIM358 (ΔlitR), and TIM355 (ΔluxOΔlitR). The strains were grown in LBS medium and harvested at an OD600 of 0.5. The transcript levels of rpoD were used as a normalizing control. Data are relative to wild-type levels, set at 1.0. Graphical and error bars indicate the averages and standard deviations of data from three independent experiments, respectively. Shared letters above the bars indicate no statistically significant difference (P > 0.05), whereas different letters indicate that there is a significant difference (P < 0.01) in rpoQ transcript levels between those strains (analysis of variance [ANOVA] and Tukey’s honestly significant difference [HSD] test).
FIG 4
FIG 4
LuxO and RpoQ regulate transcription of the VF_A1016-VF_A1017 operon. (A) Schematic representation of the rpoQ locus. Open reading frames (ORFs) are indicated as the four block arrows. VF_A1014 is predicted to encode a GGDEF-EAL-domain-containing protein of unknown function. VF_A1016 and VF_A1017 are predicted to encode a two-component histidine kinase sensor and response regulator, respectively. Numbers on the scale bar indicate the location (in bp from the origin) along the second chromosome of V. fischeri. Transcriptional start sites of rpoQ and VF_A1016 determined by 5′-RACE are shown upstream of corresponding genes. Primer sites used in RT-PCR analysis shown in panel D are indicated by arrows. (B) qRT-PCR analysis of VF_A1016 expression in V. fischeri strains MJM1100 (WT), TIM305 (ΔluxO), CA1 (ΔrpoQ), and CA4 (ΔluxOΔrpoQ). The strains were grown in LBS medium and harvested at an OD600 of 0.5. The transcript levels of rpoD were used to normalize VF_A1016 levels. Data are relative to wild-type levels, set at 1.0. Graphical and error bars indicate the averages and standard deviations of data from three independent experiments, respectively. Shared letters above the bars indicate no statistically significant difference (P > 0.05), whereas different letters indicate that there is a significant difference (P < 0.05) in VF_A1016 transcript levels between those strains (ANOVA and Tukey’s HSD test). (C) qRT-PCR analysis of VF_A1016 expression in V. fischeri strains MJM1100 (WT) and CA1 (ΔrpoQ) at a high cell density. The strains were grown in LBS medium and harvested at an OD600 of 3.0, which is 6 times denser than the cultures used for panel B. The transcript levels of rpoD were used to normalize VF_A1016 levels. Graphical and error bars indicate the averages and standard deviations, respectively, of data from three independent experiments. Different letters indicate that there is a significant difference (P < 0.001) in VF_A1016 transcript levels between the WT and the ΔrpoQ mutant (Student’s t test). (D) RT-PCR analysis of VF_A1016-VF_A1017 transcripts. Templates used are genomic DNA (lane 1), cDNA (lane 2), and RNA (lane 3). The location of the primer pair (A1016-17F/A1016-17R) is shown in panel A. Lane M contains molecular size standards (size range, in bp, from top to bottom: 1,517, 1,200, 1,000, 900, 800, 700, 600, 500/517, 400, 300, 200, and 100).
FIG 5
FIG 5
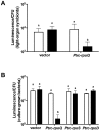
The impact of RpoQ on luminescence. (A) Squid luminescence (per CFU) of wild-type V. fischeri cells harboring either pTM214 (vector) or pXDC10 (Ptrc-rpoQ) in the presence (black bars) or absence (white bars) of 1 mM IPTG. Graphical and error bars indicate the averages and standard deviations. One representative experiment performed in triplicate is analyzed. (B) Culture luminescence per CFU of wild-type MJM1100 harboring pTM214 (vector), pXDC10 (Ptrc-rpoQ), pXDC35 (Ptrc-rpoS), and pXDC36 (Ptrc-rpoD), with (black bars) or without (white bars) IPTG addition. Graphical and error bars indicate, respectively, the averages and standard deviations, respectively, of data from three independent experiments. Shared letters above the bars indicate no statistically significant difference (P > 0.05), whereas different letters indicate a significant difference (P < 0.001 in panel A and P < 0.05 in panel B) between the luminescence levels (ANOVA and Tukey’s HSD test).
FIG 6
FIG 6
Transcriptional activity of luxICDABEG. Relative expression levels of luxICDABEG (GFP/mCherry) for strains TIM313 (WT vector), TIM315 (ΔluxO vector), CA19 (ΔlitR vector), and TIM366 (WT Tn7::Ptrc-rpoQ) either with (black bars) or without (white bars) the addition of 1 mM IPTG. Each strain carried the two-color fluorescent reporter plasmid pTM280 (PluxI-gfp PtetA-mCherry). Graphical and error bars indicate the averages and standard deviations of data from three independent experiments, respectively. Shared letters above the bars indicate no statistically significant difference (P > 0.05), whereas different letters indicate a significant difference (P < 0.05) between luxICDABEG transcript levels (ANOVA and Tukey’s HSD test).
FIG 7
FIG 7
The motility of wild-type V. fischeri cells harboring either pTM214 (WT vector) or pXDC10 (WT Ptrc-rpoQ), compared to strain TIM358 harboring either pTM214 (ΔlitR vector) or pXDC10 (ΔlitR Ptrc-rpoQ). Relative rates of motility were determined in minimal medium containing 1 mM IPTG and solidified with 0.25% agar. One representative experiment of three is shown. Growth rates of the strains were comparable in the minimal medium (data not shown).
FIG 8
FIG 8
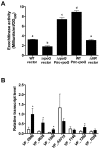
Regulation of chitinase genes by RpoQ. (A) Exochitinase activity of wild-type V. fischeri cells harboring either pTM214 (WT vector) or pXDC10 (WT Ptrc-rpoQ), strain CA1 harboring either pTM214 (ΔrpoQ vector) or pXDC10 (ΔrpoQ Ptrc-rpoQ), and TIM358 harboring pTM214 (ΔlitR vector). Secreted chitinase activity was determined in the cell-free supernatant. Graphical and error bars indicate, respectively, the averages and standard deviations of data from three independent experiments. Shared letters above the bars indicate no statistically significant difference (P > 0.05), whereas different letters indicate a significant difference (P < 0.05) in exochitinase activity between those strains (ANOVA and Tukey’s HSD test). (B) Wild-type cells carrying the empty vector plasmid (pTM214; white bars) or the inducible rpoQ allele (pXDC10; black bars) were grown in LBS medium supplemented with 1 mM IPTG and harvested at an OD600 of 1.4 to 1.5. VF_0986, chitodextrinase; VF_0655, endochitinase; VF_1598, exochitinase; VF_A0715, chitodextrinase precursor; VF_1146, chitodextrinase precursor; VF_1390, chitinase; VF_1059, chitinase. Graphical and error bars indicate, respectively, the averages and standard deviations of data from four independent experiments. The asterisks indicate a significant difference in transcription levels between each set of paired strains.
FIG 9
FIG 9
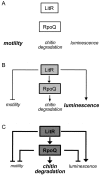
A model of RpoQ regulation of quorum-sensing-dependent phenotypes in V. fischeri. (A) At low cell density (no quorum signaling), LitR has little effect on basal levels of motility (high) and luminescence (low). (B) At moderate cell density, LitR signaling represses motility and induces luminescence as previously described (5); LitR also activates transcription of RpoQ. However, while this level of RpoQ remains insufficient to affect motility and luminescence, it does lead to increased chitinase activity. (C) At high cell density, LitR signaling increases enough to induce RpoQ to a higher level, leading to a strong repression of both motility and luminescence, as well as an induction of chitinase activity. Lines with arrowheads indicate positive regulation, while those with a bar at the end indicate negative regulation; the lines may represent a pathway with several steps of regulation.

Similar articles

Cited by

References

    1. Lee KH, Ruby EG. 1994. Effect of the squid host on the abundance and distribution of symbiotic Vibrio fischeri in nature. Appl. Environ. Microbiol. 60:1565–1571 - PMC - PubMed
    1. Milton DL. 2006. Quorum sensing in Vibrios: complexity for diversification. Int. J. Med. Microbiol. 296:61–71 - PubMed
    1. Kazmierczak MJ, Wiedmann M, Boor KJ. 2005. Alternative sigma factors and their roles in bacterial virulence. Microbiol. Mol. Biol. Rev. 69:527–543 - PMC - PubMed
    1. Bose JL, Rosenberg CS, Stabb EV. 2008. Effects of LuxCDABEG induction in Vibrio fischeri: enhancement of symbiotic colonization and conditional attenuation of growth in culture. Arch. Microbiol. 190:169–183 - PMC - PubMed
    1. Lupp C, Ruby EG. 2004. Vibrio fischeri LuxS and AinS: comparative study of two signal synthases. J. Bacteriol. 186:3873–3881 - PMC - PubMed

Publication types

LinkOut - more resources