. 2012 Dec 11;109(50):20246-53.
doi: 10.1073/pnas.1110564109. Epub 2012 Jan 10.

Chemical data quantify Deepwater Horizon hydrocarbon flow rate and environmental distribution

Affiliations

Chemical data quantify Deepwater Horizon hydrocarbon flow rate and environmental distribution

Thomas B Ryerson et al. Proc Natl Acad Sci U S A. .

Abstract

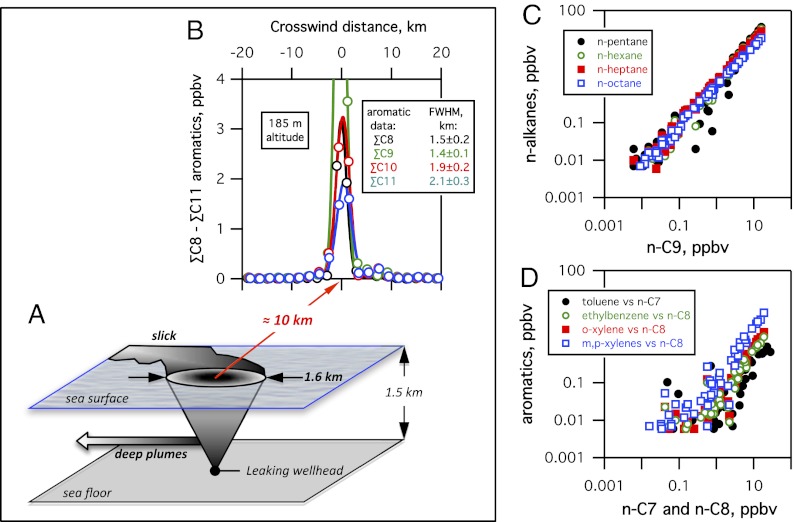
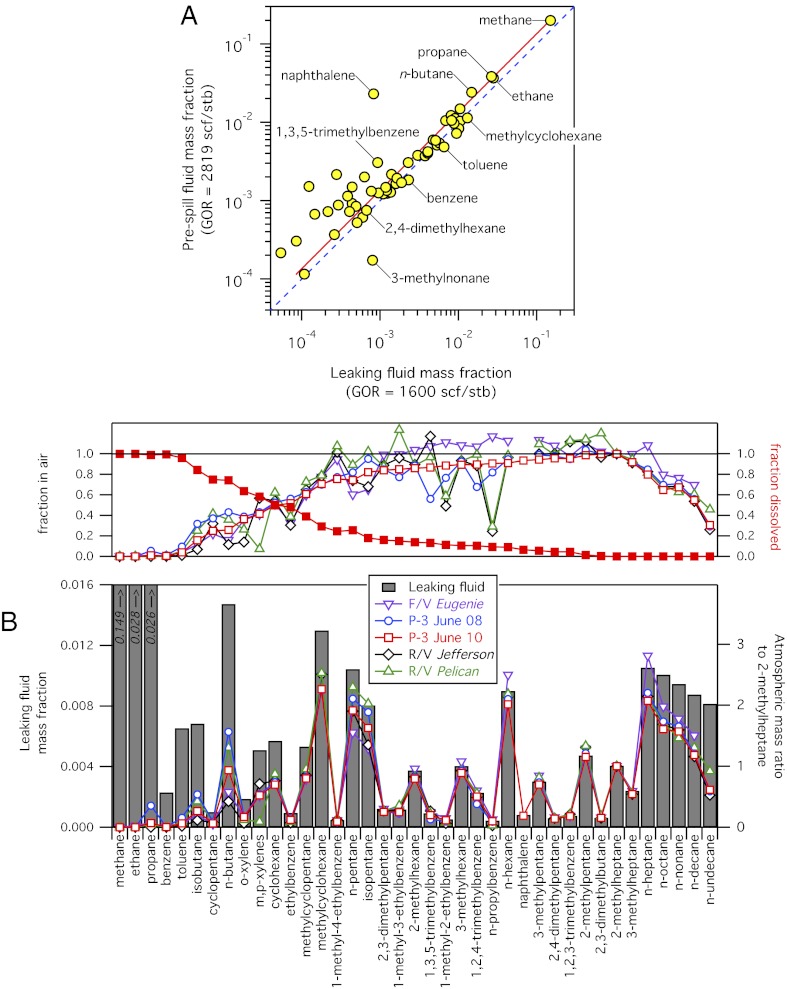
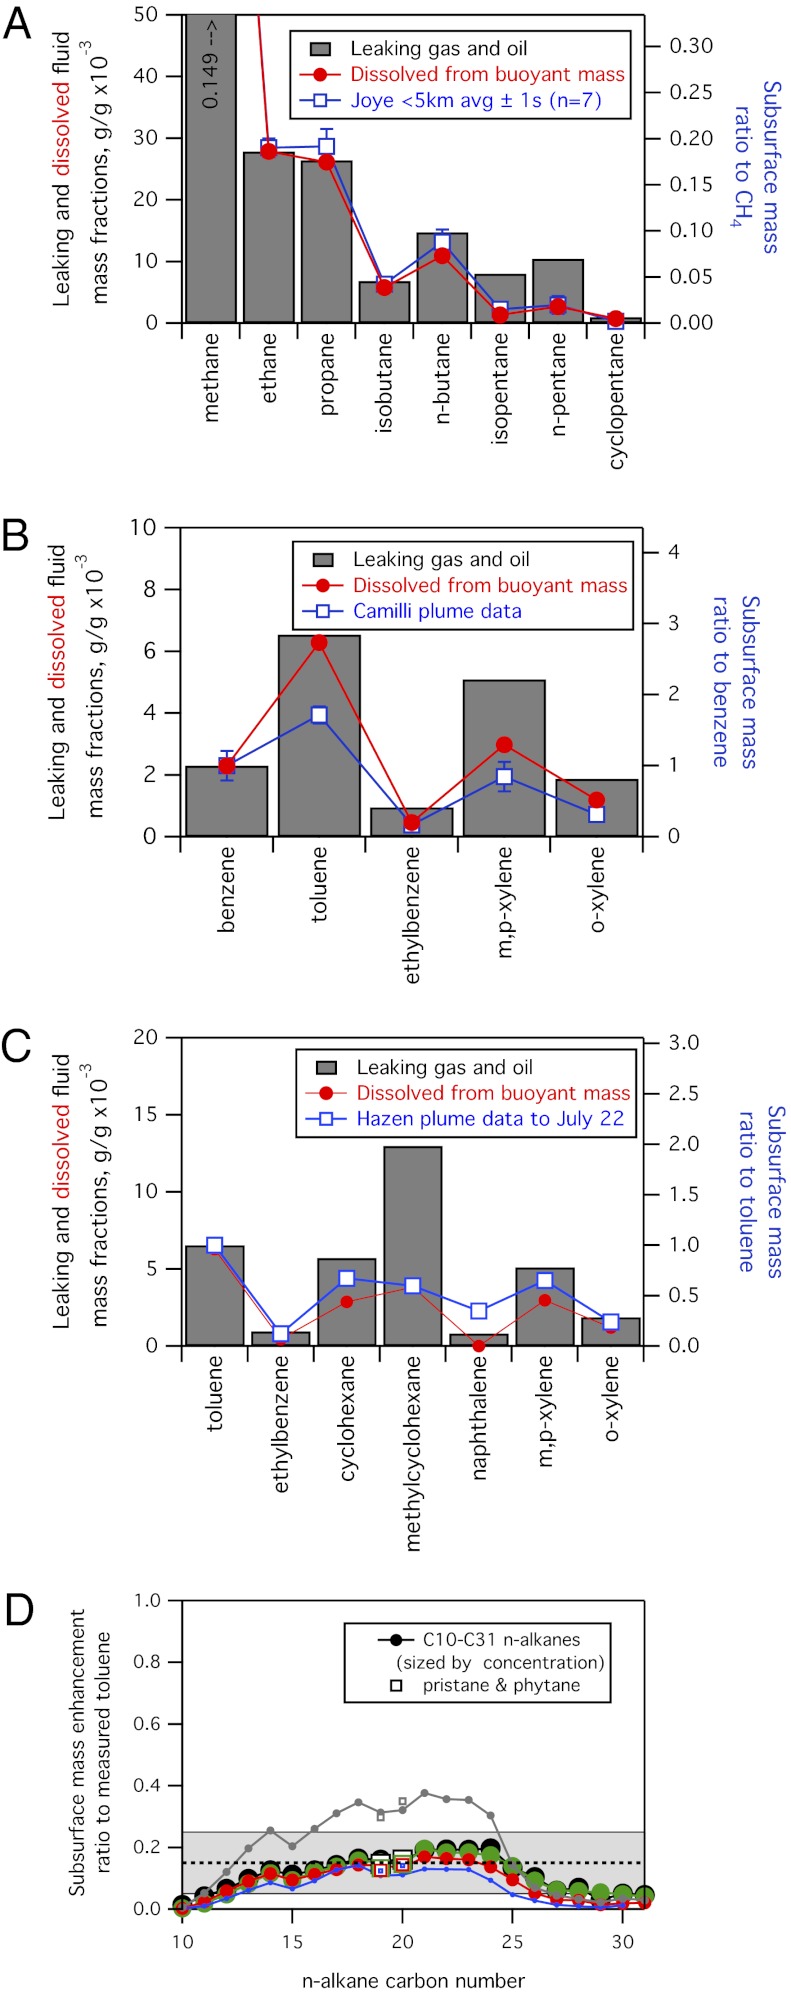
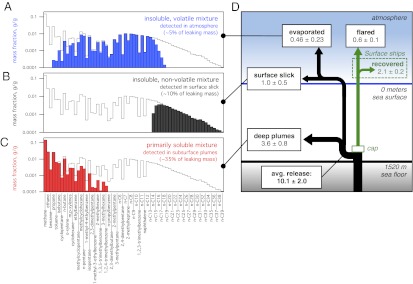
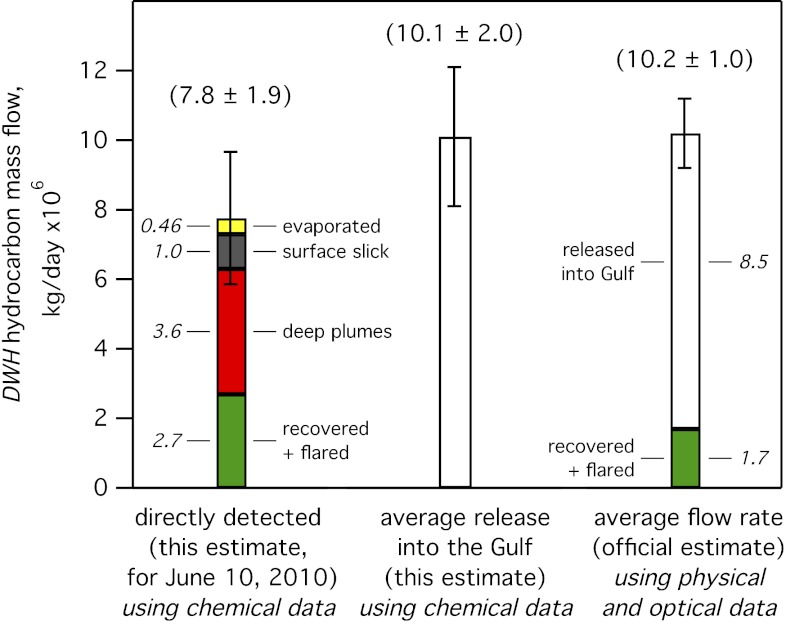
Detailed airborne, surface, and subsurface chemical measurements, primarily obtained in May and June 2010, are used to quantify initial hydrocarbon compositions along different transport pathways (i.e., in deep subsurface plumes, in the initial surface slick, and in the atmosphere) during the Deepwater Horizon oil spill. Atmospheric measurements are consistent with a limited area of surfacing oil, with implications for leaked hydrocarbon mass transport and oil drop size distributions. The chemical data further suggest relatively little variation in leaking hydrocarbon composition over time. Although readily soluble hydrocarbons made up ∼25% of the leaking mixture by mass, subsurface chemical data show these compounds made up ∼69% of the deep plume mass; only ∼31% of the deep plume mass was initially transported in the form of trapped oil droplets. Mass flows along individual transport pathways are also derived from atmospheric and subsurface chemical data. Subsurface hydrocarbon composition, dissolved oxygen, and dispersant data are used to assess release of hydrocarbons from the leaking well. We use the chemical measurements to estimate that (7.8 ± 1.9) × 10(6) kg of hydrocarbons leaked on June 10, 2010, directly accounting for roughly three-quarters of the total leaked mass on that day. The average environmental release rate of (10.1 ± 2.0) × 10(6) kg/d derived using atmospheric and subsurface chemical data agrees within uncertainties with the official average leak rate of (10.2 ± 1.0) × 10(6) kg/d derived using physical and optical methods.


Conflict of interest statement

The authors declare no conflict of interest.

Figures

Fig. 1.
Fig. 1.
(A) Scale diagram of surfacing hydrocarbon plume dimensions; the atmospheric plume data are consistent with a surface source area of ∼1.6 km in diameter. ppbv, parts per billion by volume. (B) Gaussian fits to hydrocarbon composition data and corresponding full width at half maximum (FWHM) from crosswind P-3 aircraft transects of the evaporating plume 10 km downwind of DWH; data from a single transect are shown as an example. (C) Data above the detection limit [>5 parts per trillion by volume (pptv)] from all DWH plume transects show no evidence for different populations of n-C4 through n-C8 alkanes relative to n-C9 (different volatilities and solubilities). (D) Data >5 pptv from all transects show no evidence for different populations of C7 and C8 aromatics relative to n-alkanes of the same carbon number (similar volatilities but different solubilities).
Fig. 2.
Fig. 2.
(A) Prespill Macondo reservoir hydrocarbon mass fraction (mass of compound per mass of reservoir fluid) (2) plotted vs. leaking fluid hydrocarbon mass fraction measured during the spill in mid-June (5). Each data point represents an individual hydrocarbon compound; several are labeled for illustration. Data for methane (CH4) through n-undecane (C11H24) are shown, comprising 38% of the total mass of the leaking fluid. The dashed line (blue) has a slope of unity; the slope of a linear-least-squares fit (red) is, within estimated errors, not significantly different from unity. Gas-to-oil ratio (GOR) data are given in units of standard cubic feet per stock tank barrel (scf/stb). (B) (Lower) Atmospheric hydrocarbon mass enhancement ratios to measured 2-methylheptane (open symbols) from research vessels and aircraft reflect the undissolved and volatile components of the leaking fluid (gray bars). (Upper) Fractions in air (open symbols) are the atmospheric enhancement ratios normalized to the expected ratio to 2-methylheptane in the leaking fluid. The dissolved fraction (filled squares) is calculated from the data from June 10, 2010.
Fig. 3.
Fig. 3.
(A) Subsurface near-field plume data (blue) from Joye et al. (table 2 in ref. 17), normalized to measured methane, compared with the composition of leaking gas and oil (gray) and the composition inferred for the mixture dissolved from the promptly surfacing mass (red). The seven most concentrated samples (CH4 > 45,000 nM) sampled within 5 km of the well were averaged; the isobutane and n-butane data were transposed, and isomer-specific pentane data were apportioned according to their relative abundance in the leaking fluid. (B) As in A using subsurface plume data from Camilli et al. (14) normalized to measured benzene. (C) As in A using subsurface benzene, toluene, ethylbenzene, and total xylenes (BTEX) plume data >5 μg/L seawater from five separate samples (colored lines and markers) reported in Hazen et al. (16) normalized to measured toluene. (D) As in A using subsurface n-alkane plume data >2.5 μg/L seawater from Hazen et al. (16) normalized to measured toluene. The average and range of (0.15 ± 0.10) used to scale the dissolved oxygen (DO) observations are shown by the dashed line and shading, respectively.
Fig. 4.
Fig. 4.
Evaporated hydrocarbon composition after 2 d (A; blue bars), surface oil slick composition after 2 d (B; black bars), and dissolved hydrocarbon composition (C; red bars). The leaking hydrocarbon composition from CH4 through n-C39 (black line) is shown in each panel for comparison. (D) Schematic (not to scale) of hydrocarbon mass flows in the marine environment; values are calculated for June 10, 2010, in millions of kilograms per day.
Fig. 5.
Fig. 5.
Left-hand bar shows DWH hydrocarbon mass flow, in millions of kilograms for June 10, 2010, along different environmental transport pathways calculated using the chemical composition data. The center bar shows the calculated release into the Gulf averaged over the spill duration, and the right-hand bar shows the official estimate of total hydrocarbon mass flow averaged over the spill duration.

Similar articles

Cited by

References

    1. McNutt MK, et al. Assessment of Flow Rate Estimates for the Deepwater Horizon/Macondo Well Oil Spill. Flow Rate Technical Group Report to the National Incident Command Interagency Solutions Group. 2011. Available at http://www.doi.gov/deepwaterhorizon/loader.cfm?csModule=security/getfile.... Accessed December 13, 2011.
    1. Ryerson TB, et al. Atmospheric emissions from the Deepwater Horizon spill constrain air–water partitioning, hydrocarbon fate, and leak rate. Geophys Res Lett. 2011;38(L07803) 10.1029/2011GL0467.
    1. Graham R, et al. Deep Water: The Gulf Oil Disaster and the Future of Offshore Drilling. 2010. National Commission on the BP Deepwater Horizon Oil Spill and Offshore Drilling Report to the President. Available at http://www.gpoaccess.gov/deepwater/deepwater.pdf. Accessed December 13, 2011.
    1. de Gouw JA, et al. Organic aerosol formation downwind from the Deepwater Horizon oil spill. Science. 2011;331:1295–1299. - PubMed
    1. Reddy CM, et al. Composition and fate of gas and oil released to the water column during the Deepwater Horizon oil spill. Proc Natl Acad Sci USA. 2012;109:20229–20234. - PMC - PubMed

Publication types