Comparative Study
. 2012 Jan 24;109(4):1204-9.
doi: 10.1073/pnas.1115761109. Epub 2012 Jan 10.

Deciphering the genetic architecture of variation in the immune response to Mycobacterium tuberculosis infection

Affiliations
Comparative Study

Deciphering the genetic architecture of variation in the immune response to Mycobacterium tuberculosis infection

Luis B Barreiro et al. Proc Natl Acad Sci U S A. .

Abstract

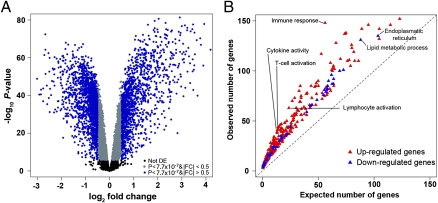
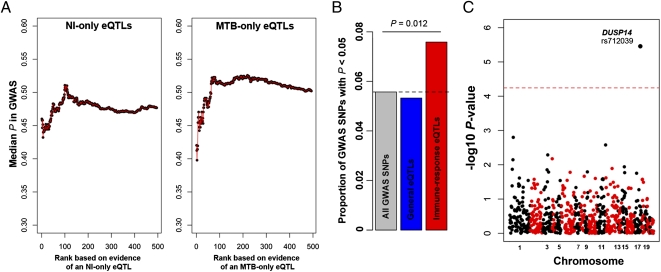
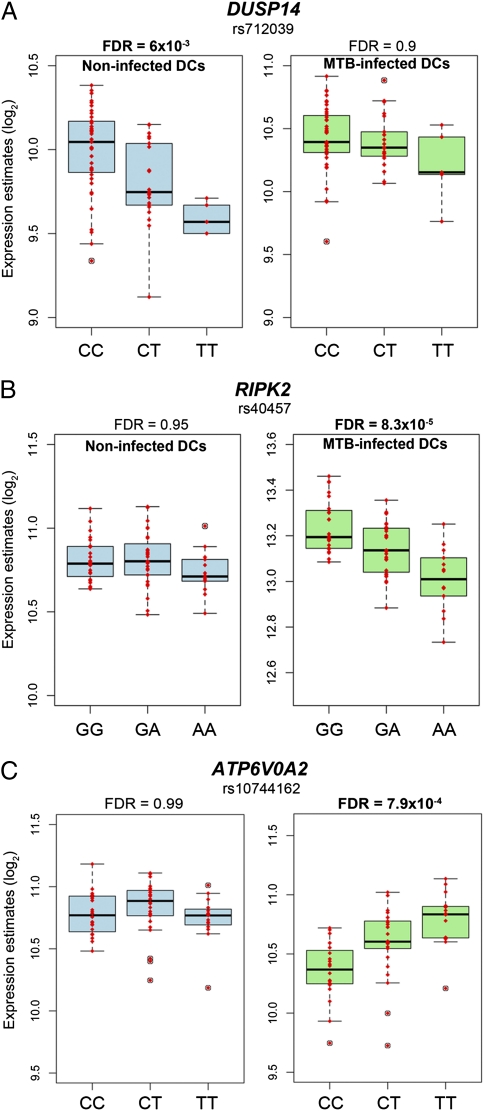
Tuberculosis (TB) is a major public health problem. One-third of the world's population is estimated to be infected with Mycobacterium tuberculosis (MTB), the etiological agent causing TB, and active disease kills nearly 2 million individuals worldwide every year. Several lines of evidence indicate that interindividual variation in susceptibility to TB has a heritable component, yet we still know little about the underlying genetic architecture. To address this, we performed a genome-wide mapping study of loci that are associated with functional variation in immune response to MTB. Specifically, we characterized transcript and protein expression levels and mapped expression quantitative trait loci (eQTL) in primary dendritic cells (DCs) from 65 individuals, before and after infection with MTB. We found 198 response eQTL, namely loci that were associated with variation in gene expression levels in either untreated or MTB-infected DCs, but not both. These response eQTL are associated with natural regulatory variation that likely affects (directly or indirectly) host interaction with MTB. Indeed, when we integrated our data with results from a genome-wide association study (GWAS) for pulmonary TB, we found that the response eQTL were more likely to be genetically associated with the disease. We thus identified a number of candidate loci, including the MAPK phosphatase DUSP14 in particular, that are promising susceptibility genes to pulmonary TB.


Conflict of interest statement

The authors declare no conflict of interest.

Figures

Fig. 1.
Fig. 1.
Functional characterization of immune responses to MTB infection. (A) Volcano plot showing differentially expressed genes after infection of DCs with MTB for 18 h. The negative log10 transformed P values test the null hypothesis of no difference in expression levels between untreated and infected DCs (y axis) and are plotted against the average log2 fold changes in expression (x axis). Data for genes that were not classified as differentially expressed are plotted in black. In gray and blue, we plotted data for genes that are differentially expressed after infection with MTB (P value <7.7 × 10⁻⁷; Bonferroni corrected P value <0.01) with an absolute log2 fold change (|FC|) less than or equal to 0.5 or greater than 0.5, respectively. (B) Gene ontology (GO) enrichment analysis for genes that were classified as up- (red) or down- (blue) regulated following infection of DCs with MTB. Only significant enrichments at an FDR <1% are plotted (complete results in Dataset S2).
Fig. 2.
Fig. 2.
Deciphering the genetic basis of interindividual variation in immune response to MTB infection. (A) Plot contrasting the evidence for cis-eQTL in the untreated and infected DCs. For every gene we plotted the additive model P values (−log10 transformed) for the most strongly associated cis-SNP (defined as SNPs located in 200-kb window centered on the TSS of a proximal gene) with gene expression levels in the untreated (x axis) or infected (y axis) DCs, respectively. The red dashed lines specify the P values corresponding to an FDR of 1%. The blue dashed lines specify the second, more relaxed, cutoff (∼50% FDR) used to confidently classify response eQTL. Only genes with strong evidence of a cis-eQTL in at least one of the conditions (FDR of 1%) are plotted. (B) Proportion of cis-eQTL (y axis) observed among all tested genes and among genes that were classified as differentially expressed (DEG) following infection with MTB. (C) Example of a response eQTL found only in the untreated samples. (D) Example of a response eQTL found only in the infected samples.
Fig. 3.
Fig. 3.
Association between cis-eQTL and protein secretion levels. (A) Boxplot of Spearman correlations between mRNA and protein expression levels. (B) Examples of data from TNF-α, IFN-γ, and IL-12 (from Left to Right). Protein level measurements from untreated (green) and infected (red) DCs from each of the 65 individuals are plotted. Results for the remaining proteins can be found in Fig. S2. P values were obtained using a nonparametric Wilcoxon test, which takes into account the paired nature of our data. (C) Manhattan plot showing the negative log10 transformed P values (y axis) for the association between all SNPs classified as cis-eQTL and the secretion levels of IL-1Ra measured in the supernatant of infected DCs. (D) Correlation between genotypes at rs11960575 and the relative secretion levels of IL-1Ra. In addition to the association between rs11960575 and IL-1Ra secretion levels, we also found a significant association (Bonferroni P < 1.7 × 10⁻⁶) between rs854100 and the secretion levels of IL-15, although the secretion levels of IL-15 after infection were very low (Figs. S2 and S3).
Fig. 4.
Fig. 4.
MTB-response eQTL are strong candidates to impact susceptibility to pulmonary TB. (A) The median GWAS P value for an expanding window of genes is plotted. We used the GWAS P values obtained when combining the Ghana and Gambia cohorts (16). Genes are ordered by the strength of evidence supporting an association with an eQTL only in the untreated (Left) or the infected (Right) DCs, respectively. To avoid positional biases, we restricted our analyses to the set of cis-SNPs that was tested in our study (i.e., SNPs located in 200-kb window centered on the TSS of proximal genes). (B) Histogram of the proportion of GWAS SNPs with nominal P values <0.05 among all GWAS SNPs (gray), among SNPs that were classified as eQTL in both untreated and infected DCs (blue), and among response eQTL (red). (C) Manhattan plot showing the negative log10 transformed P values (y axis) for the association between the response eQTL identified in this study and susceptibility to pulmonary TB. The dashed line corresponds to the genome-wide significance cutoff after a conservative Bonferroni correction.
Fig. 5.
Fig. 5.
Genes with response eQTL likely to impact susceptibility to pulmonary TB. (A) Response eQTL identified for DUSP14. (B) Response eQTL identified for RIPK2. (C) Response eQTL identified for ATP6V0A2.

References

    1. Hershkovitz I, et al. Detection and molecular characterization of 9,000-year-old Mycobacterium tuberculosis from a Neolithic settlement in the Eastern Mediterranean. PLoS ONE. 2008;3:e3426. - PMC - PubMed
    1. Zink AR, et al. Characterization of Mycobacterium tuberculosis complex DNAs from Egyptian mummies by spoligotyping. J Clin Microbiol. 2003;41:359–367. - PMC - PubMed
    1. World Health Organization . WHO Report 2009: Global Tuberculosis Control: Epidemiology, Strategy, and Financing. Geneva: WHO; 2009.
    1. North RJ, Jung YJ. Immunity to tuberculosis. Annu Rev Immunol. 2004;22:599–623. - PubMed
    1. Young DB, Gideon HP, Wilkinson RJ. Eliminating latent tuberculosis. Trends Microbiol. 2009;17:183–188. - PubMed

Publication types

MeSH terms

Substances

Associated data