. 2012 Jan 31;106(3):525-37.
doi: 10.1038/bjc.2011.583. Epub 2012 Jan 10.

Microcalcifications in breast cancer: novel insights into the molecular mechanism and functional consequence of mammary mineralisation

Affiliations

Microcalcifications in breast cancer: novel insights into the molecular mechanism and functional consequence of mammary mineralisation

R F Cox et al. Br J Cancer. .

Abstract

Background: Mammographic microcalcifications represent one of the most reliable features of nonpalpable breast cancer yet remain largely unexplored and poorly understood.

Methods: We report a novel model to investigate the in vitro mineralisation potential of a panel of mammary cell lines. Primary mammary tumours were produced by implanting tumourigenic cells into the mammary fat pads of female BALB/c mice.

Results: Hydroxyapatite (HA) was deposited only by the tumourigenic cell lines, indicating mineralisation potential may be associated with cell phenotype in this in vitro model. We propose a mechanism for mammary mineralisation, which suggests that the balance between enhancers and inhibitors of physiological mineralisation are disrupted. Inhibition of alkaline phosphatase and phosphate transport prevented mineralisation, demonstrating that mineralisation is an active cell-mediated process. Hydroxyapatite was found to enhance in vitro tumour cell migration, while calcium oxalate had no effect, highlighting potential consequences of calcium deposition. In addition, HA was also deposited in primary mammary tumours produced by implanting the tumourigenic cells into the mammary fat pads of female BALB/c mice.

Conclusion: This work indicates that formation of mammary HA is a cell-specific regulated process, which creates an osteomimetic niche potentially enhancing breast tumour progression. Our findings point to the cells mineralisation potential and the microenvironment regulating it, as a significant feature of breast tumour development.


Conflict of interest statement

The authors declare no conflict of interest.

Figures

Figure 1
Figure 1
Investigating the mineralisation potential of 4T1 cells. Representative Alizarin red S (A) and von Kossa (B) staining of 4T1 cells over time in culture (original magnification × 100) (n=3). Scale bars represent 500 μm. (C) The calcium content of 4T1 cells as determined by the o-cresolphthalein calcium assay and normalised to protein. Each point represents the mean amount of calcium measured in p.p.m. normalised to protein measured in mg, ±s.e.m., two-way ANOVA. *P<0.05 OC vs control on day 21. ***P<0.001 OC vs control on day 28. (D) Raman spectroscopy of mineralising 4T1 cells grown in the OC for 28 days showing a peak at 960 cm−1. Control=regular growth media. Osteogenic cocktail=regular growth media supplemented with 50 μg ml–1 ascorbic acid and 10 mM βG. OC&dex=regular growth media supplemented with 50 μg ml–1 ascorbic acid, 10 mM βG and 10−7M dexamethasone.
Figure 2
Figure 2
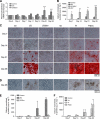
Mineralisation of mouse mammary tumours. Serial sections of 4T1 and 4T1.2 mammary fat pad tumours were stained using alizarin red S, von Kossa (including nuclear fast red counterstain) and H&E. Mineralisation was detected in five out of six primary 4T1.2 tumours and one out of five primary 4T1 tumours. Representative images of 4T1.2 primary tumours are shown. Scale bars represent 800 μm at × 100 magnification and 200 μm at × 400 magnification. Alizarin red S and von Kossa staining are positive for calcium (red) and calcium phosphate (black/brown), respectively. Haematoxylin also stained more intensely in areas of calcifications.
Figure 3
Figure 3
The effect of 1 mM PFA, a known inhibitor of Na-Pi co-transporters, on mineralisation of 4T1 cells. All images are viewed under the light microscope at × 100 magnification and the scale bars represent 500 μm (n=3). (A) Alizarin red S staining of 4T1 cells treated with 1 mM PFA. (B) Von Kossa staining of 4T1 cells treated with 1 mM PFA for 28 days. The effect of 1 mM PFA on mineralisation of 4T1 cells as determined by the o-cresolphthalein calcium assay is shown in (C) and (D). Each point represents the mean amount of calcium measured in p.p.m. normalised to protein measured in mg, ±s.e.m., two-way ANOVA. ***P<0.001 βG and Pi vs all other treatment groups at each time point. Ctl (control)=regular growth media. βG=10 mM βG. PFA=1 mM PFA. βG&PFA=10 mM βG and 1 mM PFA. Pi=10 mM Pi. Pi&PFA=10 mM Pi and 1 mM PFA.
Figure 4
Figure 4
The role of ALP in 4T1 cell mineralisation. (A) The expression of ALP mRNA analysed using real-time RT–PCR. The results are expressed in arbitrary units and normalised to the controls at each time point. Each point represents the mean±s.e.m., n=3, two-way ANOVA. *P<0.05 OC&dex vs control on days 7 and 14. ***P<0.001 OC vs control and OC&dex on days 21 and 28. (B) The effect of exogenous ALP, as determined by the o-cresolphthalein calcium assay. Each point represents the mean amount of calcium measured in p.p.m. normalised to protein measured in mg, ±s.e.m., two-way ANOVA. *P<0.05 OC&ALP vs all groups on day 7, **P<0.01 OC&ALP vs all groups on days 14 and 21, ***P<0.001 OC&ALP vs all groups on day 28. (C) Alizarin red S staining of 4T1 cells treated with 100 μM levamisole (lev) as viewed under the light microscope at × 100 magnification. The scale bar represents 500 μm. (D) Von Kossa staining of 4T1 cells treated with 100 μM lev for 28 days as viewed under the light microscope at × 100 magnification. The scale bar represents 500 μm. βG, Pi and Pi&lev samples stain positive for calcium phosphate (black) by day 28. No positive staining was observed in the control, βG&lev and lev groups. The effect of lev on mineralisation of 4T1 cells as determined by the o-cresolphthalein calcium assays is shown in (E) and (F). Each point represents the mean amount of calcium measured in p.p.m. normalised to protein measured in mg, ±s.e.m., two-way ANOVA. *P<0.05 Pi vs control on day 28, **P<0.01 Pi&lev vs control on day 28, ***P<0.001 βG vs control and βG&lev on day 28. Osteogenic cocktail=50 μg ml–1 ascorbic acid and 10 mM βG. OC&dex=OC including 10−7M dexamethasone. ALP=1 U ml–1 ALP. OC&ALP=OC including 1 U ml–1 ALP. βG=10 mM βG. βG&lev=10 mM βG and 100 μM lev. Lev=100 μM lev. Pi=10 mM Pi. Pi&lev=10 mM Pi and 100 μM lev.
Figure 5
Figure 5
The effect of known inhibitors of physiological mineralisation on 4T1 cells and the influence of endogenous ALP activity. (A) The expression of OPN mRNA analysed using real-time RT–PCR. The results are expressed in arbitrary units and normalised to the controls at each time point. Each point represents the mean±s.e.m., n=3, two-way ANOVA. *P<0.05 OC vs control and OC&dex on day 21. ***P<0.001 OC&dex vs control and OC on day 11. (B) The effect of exogenous OPN on mineralisation of 4T1 cells, as determined by the o-cresolphthalein calcium assay. Each point represents the mean amount of calcium measured in p.p.m. normalised to protein measured in mg, ±s.e.m., one-way ANOVA. **P<0.01 OC and OC&OPN vs control on day 21. (C) The effect of PPi on mineralisation of 4T1 cells, as determined by the o-cresolphthalein calcium assay. Each point represents the mean amount of calcium measured in p.p.m. normalised to protein measured in mg, ±s.e.m., two-way ANOVA. **P<0.01 OC vs control and PPi on day 28, ***P<0.001 OC&PPi vs control and PPi on day 28. (D) An ALP stain carried out on 4T1 cells, as observed under the light microscope at × 100 magnification. The scale bar represents 500 μm. Positive staining for ALP (pink) is observed on days 7 and 14 in the control (Ctl), OC and OC&dex groups. (E) An ALP stain carried out on MCF10a cells, as observed under the light microscope at × 100 magnification. The scale bar represents 500 μm. No positive staining for ALP was observed for any treatment group at any time point. (F) A comparison of ALP activity in 4T1 and MCF10a cells. The results are expressed in ALP (pg) normalised to protein (μg). Each point represents the mean±s.e.m., two-way ANOVA. *P<0.05 OC&dex vs control on day 7 in 4T1 cells, ***P<0.001 OC and OC&dex vs control on day 14 in 4T1 cells. Osteogenic cocktail=50 μg ml–1 ascorbic acid and 10 mM βG. OC&dex=OC including 10−7M dexamethasone. OC&PPi=OC and 3.5 μM pyrophosphate. PPi=3.5 μM pyrophosphate. OC&OPN=OC and 0.5 μg ml–1 OPN.
Figure 6
Figure 6
Investigating the effect of increasing concentrations of βG, calcium (Ca2+), CO and HA on 4T1 cell migration using a scratch wound assay. (A) The scratch wound assay of 4T1 cells treated with βG. By 48 h, an increase in cell migration is observed with 10 mM βG treatment compared with the control group (ctl; growth media containing 0.5% FBS), which was found to be statistically significant when quantified using Scion image software. (B) The scratch wound assay of 4T1 cells treated with increasing concentrations of calcium. By 48 h, an increase in cell migration is observed with 10 mM Ca2+ treatment compared with the 1.8 mM Ca2+ group (growth media containing 0.5% FBS), which was found to be statistically significant when quantified using Scion image software. (C) The scratch wound assay of 4T1 cells treated with increasing concentrations of CO. No significant differences in cell migration were detected between the different treatment groups at any time point. (D) The scratch wound assay of 4T1 cells treated with increasing concentrations of HA. An increase in cell migration is observed for the 72 μg cm–2 HA-treated cells compared with the control group by 48 h, which was confirmed as statistically significant when quantified using Scion image software. All images are viewed under a light microscope at × 100 magnification at 0, 24 and 48 h (n=3). The scale bars represent 500 μm. For quantification, each point represents the mean percentage scratch wound closure ±s.e.m., two-way ANOVA. **P<0.01 10 mM βG, 10 mM Ca2+ and 72 μg cm–2 HA vs control at 48 h.
Figure 7
Figure 7
A proposed mechanism of mammary cell mineralisation. βG is hydrolysed to glycerol (G) and Pi by ALP. Inorganic phosphate is internalised by the type II family of Na-Pi cotransporters. Once inside the cell, Pi combines with calcium (Ca) to form HA. Upregulation of ALP mRNA takes place. Hydroxyapatite enters the extracellular matrix, by an as of yet unknown mechanism. Inorganic pyrophosphate acts as a natural inhibitor of HA formation. However, the overexpression of ALP by tumourigenic mammary cells may result in PPi hydrolysis to Pi, which can subsequently be incorporated into HA. Osteopontin is also a natural inhibitor of HA formation, however, overexpression of ALP may dephosphorylate OPN rendering it inactive and thereby removing its inhibitory effect. Hydroxyapatite crystals present in the extracellular matrix enhance the proliferation and migration of surrounding cells and further aggravate tumour growth and metastasis.

Similar articles

Cited by

References

    1. Addison WN, Azari F, Sorensen ES, Kaartinen MT, McKee MD (2007) Pyrophosphate inhibits mineralization of osteoblast cultures by binding to mineral, up-regulating osteopontin, and inhibiting alkaline phosphatase activity. J Biol Chem 282: 15872–15883 - PubMed
    1. Aslakson CJ, Miller FR (1992) Selective events in the metastatic process defined by analysis of the sequential dissemination of subpopulations of a mouse mammary tumor. Cancer Res 52: 1399–1405 - PubMed
    1. Baker R, Rogers KD, Shepherd N, Stone N (2010) New relationships between breast microcalcifications and cancer. Br J Cancer 103: 1034–1039 - PMC - PubMed
    1. Bellahcene A, Castronovo V (1995) Increased expression of osteonectin and osteopontin, two bone matrix proteins, in human breast cancer. Am J Pathol 146: 95–100 - PMC - PubMed
    1. Bellahcene A, Merville MP, Castronovo V (1994) Expression of bone sialoprotein, a bone matrix protein, in human breast cancer. Cancer Res 54: 2823–2826 - PubMed

Publication types