. 2012 Feb 15;31(4):895-907.
doi: 10.1038/emboj.2011.485. Epub 2012 Jan 10.

Endogenous DNA replication stress results in expansion of dNTP pools and a mutator phenotype

Affiliations

Endogenous DNA replication stress results in expansion of dNTP pools and a mutator phenotype

Marta B Davidson et al. EMBO J. .

Abstract

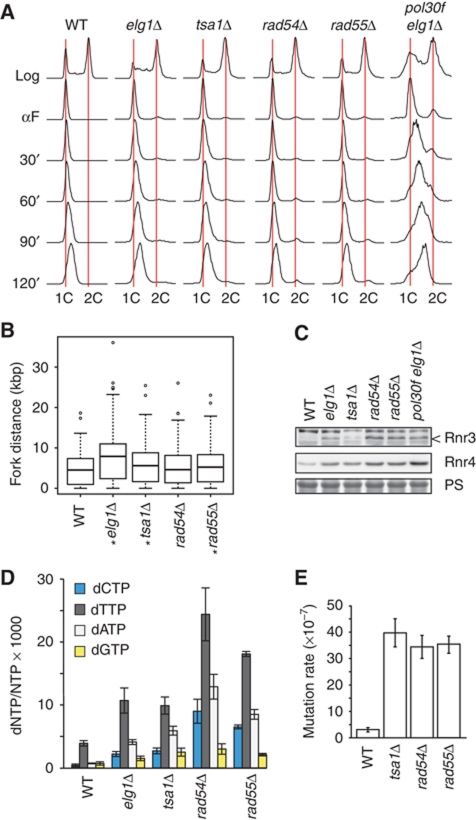
The integrity of the genome depends on diverse pathways that regulate DNA metabolism. Defects in these pathways result in genome instability, a hallmark of cancer. Deletion of ELG1 in budding yeast, when combined with hypomorphic alleles of PCNA results in spontaneous DNA damage during S phase that elicits upregulation of ribonucleotide reductase (RNR) activity. Increased RNR activity leads to a dramatic expansion of deoxyribonucleotide (dNTP) pools in G1 that allows cells to synthesize significant fractions of the genome in the presence of hydroxyurea in the subsequent S phase. Consistent with the recognized correlation between dNTP levels and spontaneous mutation, compromising ELG1 and PCNA results in a significant increase in mutation rates. Deletion of distinct genome stability genes RAD54, RAD55, and TSA1 also results in increased dNTP levels and mutagenesis, suggesting that this is a general phenomenon. Together, our data point to a vicious circle in which mutations in gatekeeper genes give rise to genomic instability during S phase, inducing expansion of the dNTP pool, which in turn results in high levels of spontaneous mutagenesis.


Conflict of interest statement

The authors declare that they have no conflict of interest.

Figures

Figure 1
Figure 1
pol30 elg1Δ mutants are resistant to inhibition of DNA replication by HU. (A) Western blot analysis of whole cell extracts prepared from the indicated logarithmically growing strains. Immunoblots were probed with anti-PCNA antibody. Ponceau S staining of the blot is shown in the bottom panel as a loading control. (B) Logarithmically growing cultures of the indicated strains were arrested in G1 with alpha factor (αF) and released into 0.2 M HU. At the indicated times, samples were fixed and DNA contents were analysed by flow cytometry. The positions of cells with 1C and 2C DNA contents are indicated. (C) DNA replication was measured in wild type and pol30felg1Δ by comparative genome hybridization on tiling microarrays after logarithmically growing cells were arrested in G1 with alpha factor and released into 0.2 M HU for 60 min. The log2 ratio of signal from each S phase (HU) sample relative to unreplicated (G1) DNA is shown for chromosome XV. Replicated regions, defined by identifying peaks that overlap replication origins, along chromosome XV are shown as red bars below each histogram. Confirmed replication origins annotated in oriDB are indicated, early-firing origins in green, late-firing origins in blue, and origins without timing data in black (McCune et al, 2008). Late-firing ARS1506.5 is indicated by an asterisk. (D) Replication fork distance distributions after 30 min in HU. The distance from the centre of each ARS to peak edge for 166 replication forks across the genome was measured and the result displayed as a boxplot. The median is indicated by the horizontal bar, the box spans the first through third quartiles, the whiskers extend to the last data points within 1.5 times the interquartile range, and outliers are plotted as circles. Median fork distance significantly greater than wild type (P<0.01, one-tail Wilcoxon rank-sum test) is indicated (*), as is median fork distance significantly greater than elg1Δ and pol30f (**P<0.01). (E) Replication fork distance distributions after 60 min in HU. (F) Replication fork rate distribution, between 30 and 60 min in HU. Fork rate was measured for 88 replication forks as the difference in fork distance between 60 and 30 min in HU, divided by 30 min. Fork rate in pol30f elg1Δ (260 bp/min) was significantly greater than wild type (84 bp/min; *P=3 × 10⁻⁹). (G) PCNA localizes to origin-distal regions in pol30f elg1Δ cells released from G1 into HU for 90 min. Enrichment of DNA fragments in the PCNA-bound fraction relative to the unbound fraction is shown along 500 kbp of chromosome V for pol30f (top) and pol30f elg1Δ cells (bottom). The signal intensity ratio on a log2 scale is shown on the y axis and the position along the chromosome is shown on the x axis. Positive signal represents occupancy by PCNA, and regions where the positive signal is statistically significant (Katou et al, 2006) over 300 bp are shown in orange. Replication origins are indicated.
Figure 2
Figure 2
RNR activity is upregulated in pol30f elg1Δ mutants. (A) Logarithmically growing cells were arrested in G1 with alpha factor (α) and released into 0.2 M HU. At the indicated times, samples were fixed and the level of each dNTP was measured in the strains shown. dNTP levels are expressed as dNTP:NTP ratios. (B) Western blot analysis of whole cell extracts prepared from cells that were arrested in G1 with alpha factor. Immunoblots were probed with anti-Rnr1, Rnr3, and Rnr4 antibodies to detect RNR subunits. Tubulin was used as a loading control and detected using an anti-tubulin antibody. (C) Northern blot analysis of RNA prepared from cells arrested in G1 phase. Blots were hybridized with probes for the RNR1, RNR3, and RNR4 genes. The rRNA is shown as a loading control.
Figure 3
Figure 3
pol30f elg1Δ mutants exhibit endogenous DNA damage (A) Logarithmically growing cells were arrested in G1 with alpha factor (α) and synchronously released into S phase. Samples were fixed every 20min and extracts were fractionated on a western blot and probed with anti-γH2A, Rnr1, Rnr3, Rnr4, Sml1, and PCNA antibodies. Western blots were also probed with an anti-Rad53 antibody. Phosphorylation of Rad53 causes a shift in electrophoretic mobility (Rad53-P) and is a marker for checkpoint activation as seen in the control sample of asynchronously growing wild-type cells treated with MMS (lane 1). Ponceau S staining of the Pol30 blot is shown as a protein loading control. (B) Cells sampled from (A) were analysed by flow cytometry. The positions of 1C and 2C DNA contents are indicated. (C) The indicated strains were grown asynchronously (ASY), arrested in G1 with alpha factor (αF), or treated with MMS. Cells were fixed with TCA and whole cell extracts were analysed by western blot for phosphorylation-dependent Rad53 mobility shift using an anti-Rad53 antibody. (D) Western blot analysis of whole cell extracts prepared from the indicated strains following arrest in G1 with alpha factor. Immunoblots were probed with anti-Rnr3 and Rnr4 antibodies to detect RNR subunits. Ponceau S staining is shown as a protein loading control.
Figure 4
Figure 4
pol30felg1Δ mutants exhibit a mutator phenotype. (A) The rates of forward mutation of CAN1 cells to canavanine resistance were determined. The means and standard deviations of at least three independent fluctuation tests for the indicated strains are plotted. (B) DNA contents of wild-type, pol30f elg1Δ, and pol30f elg1Δ swi4Δ cells, either in logarithmic phase (log), arrested in G1 (αF), or released synchronously into the cell cycle for the indicated times in the presence of 0.2 M HU were analysed by flow cytometry. The positions of cells with 1C and 2C DNA contents are indicated. (C) Immunoblots of samples from (B) were probed with anti-PCNA and anti-Rnr1, Rnr3, and Rnr4 antibodies to detect RNR subunits. Ponceau S staining of the Pol30 blot is shown as a protein loading control.
Figure 5
Figure 5
Distinct genome integrity mutants exhibit increased dNTP levels and are mutators. (A) DNA contents of the indicated strains, either in logarithmic phase (log), arrested in G1 (αF), or released synchronously into the cell cycle for the indicated times in the presence of 0.2 M HU were analysed by flow cytometry. The positions of cells with 1C and 2C DNA contents are indicated. (B) Replication fork distance distributions after 60 min in HU. The distance from the centre of each ARS to peak edge for 164 replication forks across the genome was measured from aCGH data, and the results displayed as a boxplot. Median fork distance significantly greater than wild type (P<0.01, one-tail Wilcoxon rank-sum test) is indicated (*). (C) Western blot analysis of whole cell extracts prepared from the indicated strains following arrest in G1 with alpha factor. Immunoblots were probed with anti-Rnr3 and Rnr4 antibodies to detect RNR subunits. Ponceau S staining is shown as a protein loading control. (D) dNTP levels, expressed as dNTP:NTP ratios, were measured for the indicated strains following release of logarithmically growing cells from G1 into 0.2 M HU for 60 min. (E) The rates of forward mutation of CAN1 cells to canavanine resistance were determined for the indicated strains. The means and standard deviations of three independent fluctuation tests are plotted.
Figure 6
Figure 6
Model of genome stability gene action in regulating dNTP levels. Mutation of genome stability genes results in DNA damage during S phase. The response to the DNA damage causes an upregulation of RNR and expansion of cellular dNTP pools, resulting in increased mutation frequency, which contributes to further genome instability.

References

    1. Alvaro D, Lisby M, Rothstein R (2007) Genome-wide analysis of Rad52 foci reveals diverse mechanisms impacting recombination. PLoS Genet 3: e228. - PMC - PubMed
    1. Alvino GM, Collingwood D, Murphy JM, Delrow J, Brewer BJ, Raghuraman MK (2007) Replication in hydroxyurea: it's a matter of time. Mol Cell Biol 27: 6396–6406 - PMC - PubMed
    1. Barlow JH, Lisby M, Rothstein R (2008) Differential regulation of the cellular response to DNA double-strand breaks in G1. Mol Cell 30: 73–85 - PMC - PubMed
    1. Bartkova J, Horejsi Z, Koed K, Kramer A, Tort F, Zieger K, Guldberg P, Sehested M, Nesland JM, Lukas C, Orntoft T, Lukas J, Bartek J (2005) DNA damage response as a candidate anti-cancer barrier in early human tumorigenesis. Nature 434: 864–870 - PubMed
    1. Bartkova J, Rezaei N, Liontos M, Karakaidos P, Kletsas D, Issaeva N, Vassiliou LV, Kolettas E, Niforou K, Zoumpourlis VC, Takaoka M, Nakagawa H, Tort F, Fugger K, Johansson F, Sehested M, Andersen CL, Dyrskjot L, Orntoft T, Lukas J et al. (2006) Oncogene-induced senescence is part of the tumorigenesis barrier imposed by DNA damage checkpoints. Nature 444: 633–637 - PubMed

Publication types

MeSH terms