Review
. 2012 Apr 7;41(7):2673-85.
doi: 10.1039/c2cs15229k. Epub 2012 Jan 10.

Silica-based nanoprobes for biomedical imaging and theranostic applications

Affiliations
Review

Silica-based nanoprobes for biomedical imaging and theranostic applications

Juan L Vivero-Escoto et al. Chem Soc Rev. .

Abstract

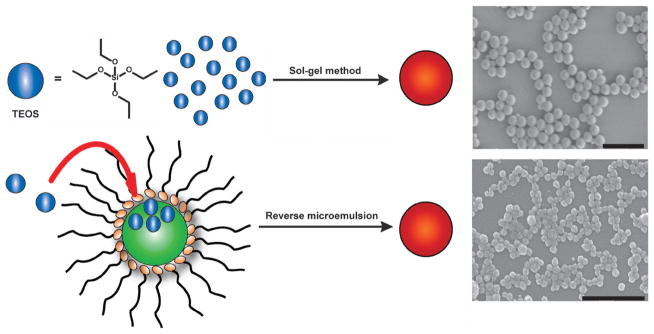
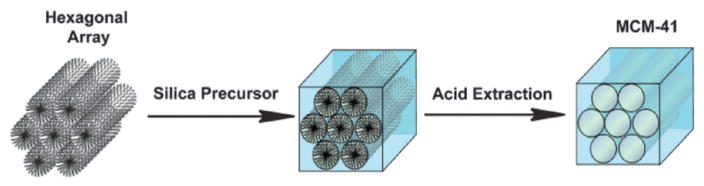
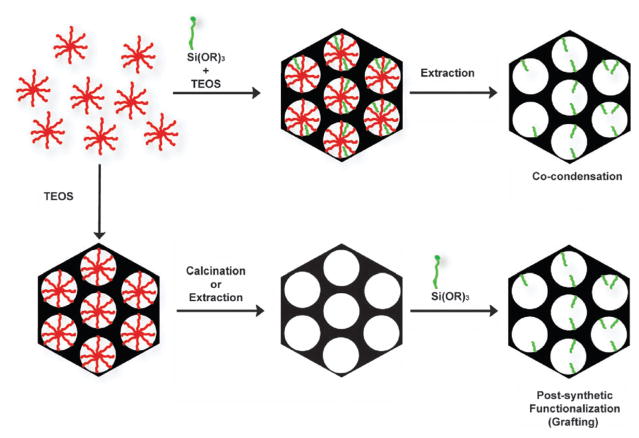
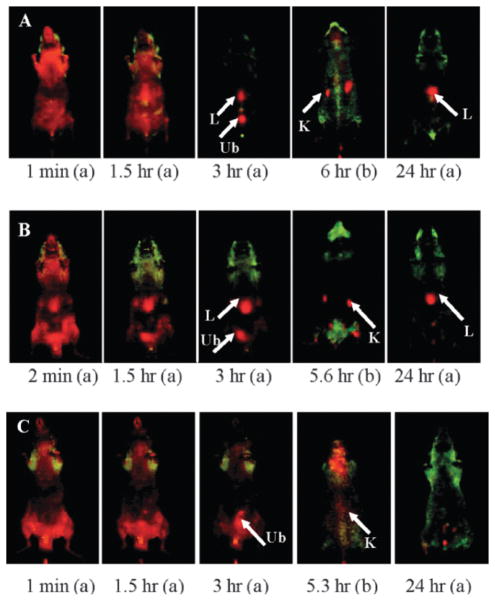
Nanoparticle-based contrast agents are attracting a great deal of attention for various biomedical imaging and theranostic applications. Compared to conventional contrast agents, nanoparticles possess several potential advantages to improve in vivo detection and to enhance targeting efficiency. Silica-based nanoprobes can be engineered to achieve longer blood circulation times, specific clearance pathways, and multivalent binding. In this tutorial review, we summarize the latest progress on designing silica-based nanoprobes for imaging and theranostic applications. The synthesis of both solid silica and mesoporous silica nanoparticles is described, along with different approaches used for surface functionalization. Special emphasis is placed on the application of silica-based nanoprobes in optical, magnetic resonance, and multimodal imaging. The latest breakthroughs in the applications of silica nanoparticles as theranostic agents are also highlighted.


Figures

Fig. 1
Fig. 1
Schematic showing the synthesis of SiNPs by the Stöber method (top), in which the hydrolysis and condensation of TEOS is facilitated by the base in ethanol and water, and via reverse phase microemulsion (bottom), in which TEOS is hydrolyzed at the micellar interface and enters the aqueous droplet to form a silica nanoparticle. The scale bars represent 1000 nm and 500 nm, respectively.
Fig. 2
Fig. 2
Schematic representation of the synthesis of MCM-41 type MSN particles. The cationic surfactant molecules self-assemble into hexagonal arrays in aqueous solution and the silica precursors then hydrolyze and condense along the exterior of the micelles to form a mesoporous material after extraction of the surfactant.
Fig. 3
Fig. 3
Functionalization of MSNs by co-condensation (top) or the post-synthetic method (bottom). A trialkoxysilane molecule bearing a functional group (green) is shown as an example of a silica precursor. The structure-directing agent is represented by micelles (red).
Fig. 4
Fig. 4
In vivo imaging of biodistribution of intravenously-injected surface-modified SiNPs at different time points post-injection: (a) abdomen image and (b) back image. (A) OH–SiNPs, (B) COOH–SiNPs. (C) PEG–SiNPs. Arrows indicate the location of the kidney (K), liver (L), and urinary bladder (Ub). Reprinted from ref. with permission from American Chemical Society.
Fig. 5
Fig. 5
Biodistribution analysis of C-dots in mice (top) and fluorescence pseudo-color imaging of a mouse bladder ex vivo (bottom). (a, b) Percent of initial particle dose (% ID) retained for 6.0 nm (a) and 3.3 nm (b) diameter C dots. (c) Plot of retained particle concentration for 3.3 nm (light gray) and 6.0 nm (black). (d) Plot of estimated particle excretion for 3.3 nm (light gray) and 6.0 nm (black). (e–i) Pseudocolor images of Cy5 fluorescence in intact mouse bladders showing the accumulation of 3.3 nm (e–h), followed by the negligible particle fluorescence seen at 24 h postinjection (i). (j–m) Pseudocolor images of Cy5 fluorescence in intact mouse bladders showing the accumulation of 6.0 nm (j–l) and at the 24 h end point (m). (n) Pseudocolor image of a control mouse bladder. Reprinted from ref. with permission from American Chemical Society.
Fig. 6
Fig. 6
Nodal mapping using multiscale NIR optical fluorescence imaging. (A) Whole-body fluorescence imaging of the tumor site (T), draining inguinal (ILN) and axillary (ALN) nodes, and communicating lymphatic channels (LCs). (B) Corresponding coregistered white-light and high-resolution fluorescence images (top row) and fluorescence images only (bottom row), revealing the nodal infrastructure of local and distant nodes, including high endothelial venules (HEVs). (C) Whole-body fluorescence image of the tumor site 10 minutes after sub-dermal PEG-dot injection. (D) Delayed whole-body fluorescence image of the tumor site 1 h after PEG-dot injection. (E) Percent increase in the area of fluorescence (fluor) relative to that measured at 10 min post-injection for targeted and nontargeted probes. Scale bars: 1.0 cm (A); 500 μm (B); 3 mm (C and D). Reprinted from ref. with permission from American Society for Clinical Investigation.
Fig. 7
Fig. 7
Microscopic images of labeled monocyte cells: (a) optical image and (b) laser scanning confocal fluorescence. (c, d) MR images of unlabeled (left) and labeled (right) monocyte cells: (c) T1-weighted and (d) T2-weighted. (e) Flow cytometry results for the unlabeled (red) and labeled (blue) monocyte cells indicating greater than 98% labeling efficiency (inset shows the purity of the labeled cells; SS = side scatter, FS = forward scatter). (f) MTS assay of the monocyte cells incubated with different amounts of nanoparticles. Reprinted from ref. with permission from John Wiley & Sons Inc.
Fig. 8
Fig. 8
(Top) Control animals (without arthritis) that were intravenously-injected with two separate doses of (A) saline, (B) 125 mg SiNPs per kg, or (C) 250 mg SiNPs per kg 12 h before imaging. (Bottom) CIA animals with arthritis that were intravenously-injected with (D) saline, (E) 125 mg SiNPs per kg, or (F) 250 mg per kg. Reprinted from ref. with permission from Clinical and Experimental Rheumatology.
Fig. 9
Fig. 9
(A) Representative T1 and T2 relaxation maps of the hindlimbs of a mouse with early stage CIA before and after SiNPs administration. (B) T2 relaxation maps of the hindlimbs of a mouse with later stage CIA before and after receiving a SiNP-based contrast agent. Reprinted from ref. with permission from Clinical and Experimental Rheumatology.
Fig. 10
Fig. 10
Schematic representation of the LbL self-assembly strategy for a dual optical and MR imaging multimodal contrast agent. Reprinted from ref. with permission from American Chemical Society.
Fig. 11
Fig. 11
(a) Dependence of per particle r1 and r2 values on the number of deposited Gd–DOTA oligomer layers. (b) T1-weighted MR images of HT-29 cells that have been incubated with various nanoparticles. From left to right: control cells without any nanoparticle, cells with LbL particles, cells with LbL particles that have been noncovalently functionalized with K7RGD, and cells with LbL particles that have been noncovalently functionalized with K7GRD. Phase contrast optical (c, e, g, and i) and confocal microscopic images (d, f, h, and j) of HT-29 cells that have been incubated with various nanoparticles: control cells without any nanoparticle (c and d), cells with LbL particles (e and f), cells with LbL particles that have been noncovalently functionalized with K7RGD (g and h), and cells with LbL particles that have been noncovalently functionalized with K7GRD (i and j). Reprinted from ref. with permission from American Chemical Society.
Fig. 12
Fig. 12
Biodistribution of FITC–MSNs in an anesthetized rat before and after (90 min) intravenous injection. The experimental conditions were set at 492 nm excitation and 518 nm emission and (a) a longer shutter time (60 s) for visible imaging and (b) a 30 s shutter time. (c) Biodistribution of ICG–MSNs in an anesthetized rat before and after intravenous injection for 90 min. The ICG–MSNs sample showed less interference from autofluorescence in a shorter shutter period (30 s). (d) ICG–MSNs in nude mice after intravenous injection for 3 h. Reprinted from ref. with permission from John Wiley & Sons Inc.
Fig. 13
Fig. 13
(a) Precontrast and (b) postcontrast (2.1 μmol kg−1 dose) T1-weighted mouse MR image showing aorta signal enhancement. (c) Precontrast and (d) postcontrast (31 μmol kg−1 dose) mouse MR images showing liver signal loss due to T2-weighted enhancement. Reprinted from ref. with permission from American Chemical Society.
Fig. 14
Fig. 14
Clinical 1.5 T MR images of a nude mouse 8 h (a) and 9 days (b) after implantation of Mag-Dye@MSN-labeled hMSCs at the frontal cortex. (a) Using a clinical 1.5 T MR scanner, the hMSCs revealed a dark dot at the frontal cortex (arrow). (b) Repeated MR scanning was carried out 9 days after hMSC implantation. The stem cells could still be visualized as a black dot at the frontal cortex. No migration of these cells is found (arrow head). Reprinted from ref. with permission from John Wiley & Sons Inc.
Fig. 15
Fig. 15
(A) Images of the two subcutaneous injections of 100 mL MB-encapsulated SiNPs with concentrations of 44 mg mL−1 (a) and 4.4 mg mL−1 (b). The acquisition was performed 2 min after injection. (B) Real-time in vivo abdomen imaging of an intravenous injection of 200 mL of MB-encapsulated SiNPs (44 mg mL−1) at different time points, post-injection. Reprinted from ref. with permission from Elsevier Ltd.
Fig. 16
Fig. 16
Schematic illustration of the nanoporous particle-supported lipid bilayer, depicting the disparate types of therapeutic and diagnostic agent that can be loaded within the nanoporous silica core, as well as the ligands that can be displayed on the surface of the SLB. Reprinted from ref. with permission from Macmillan Publishers Ltd.
Fig. 17
Fig. 17
TUNEL assay for apoptotic cell death. Tumor section from a mouse that was given intravenous injection of (a) free IO-MSN, (b) DOX loaded IO-MSN (DOX 2 mg kg−1), and (c) DOX loaded IO-MSN (DOX 4 mg kg−1). Arrows indicate examples of TUNEL-positive (brown color) cells with apoptotic morphology. Reprinted from ref. with permission from American Chemical Society.

References

    1. Choi HS, Frangioni JV. Mol Imaging. 2010;9:291–310. - PMC - PubMed
    1. Cho EC, Glaus C, Chen J, Welch MJ, Xia Y. Trends Mol Med. 2010;16:561–573. - PMC - PubMed
    1. Zrazhevskiy P, Sena M, Gao X. Chem Soc Rev. 2010;39:4326–4354. - PMC - PubMed
    1. Huang X, Jain PK, El-Sayed IH, El-Sayed MA. Nanomedicine. 2007;2:681–693. - PubMed
    1. Lin W, Hyeon T, Lanza GM, Zhang M, Meade TJ. MRS Bull. 2009;34:441–448. - PMC - PubMed

Publication types