

High-resolution genomic profiling of adult and pediatric core-binding factor acute myeloid leukemia reveals new recurrent genomic alterations
- PMID: 22234698
- PMCID: PMC3311263
- DOI: 10.1182/blood-2011-09-380444
High-resolution genomic profiling of adult and pediatric core-binding factor acute myeloid leukemia reveals new recurrent genomic alterations
Abstract
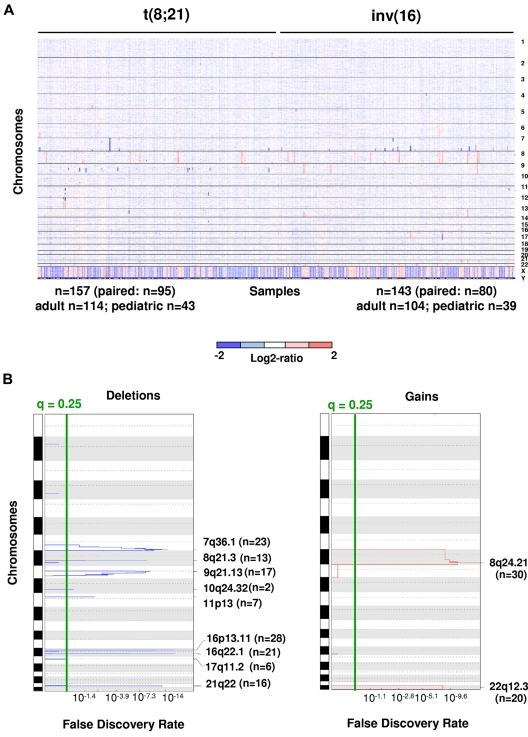
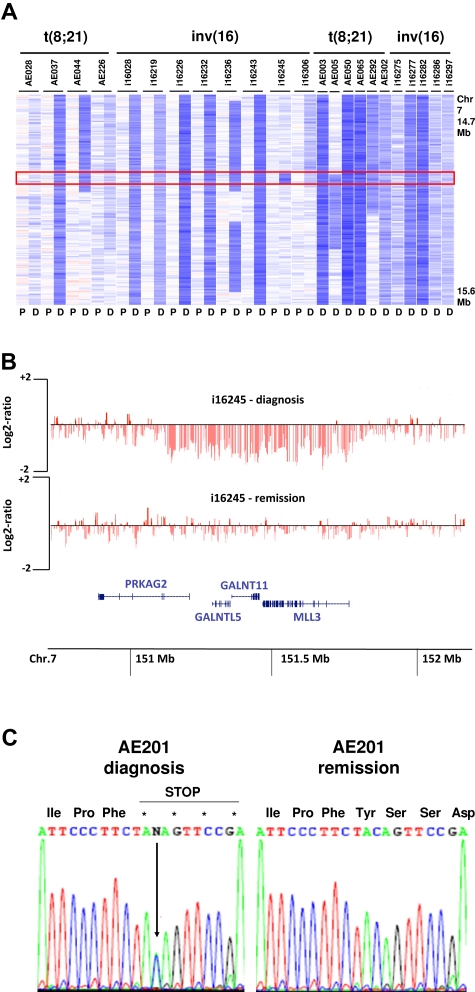
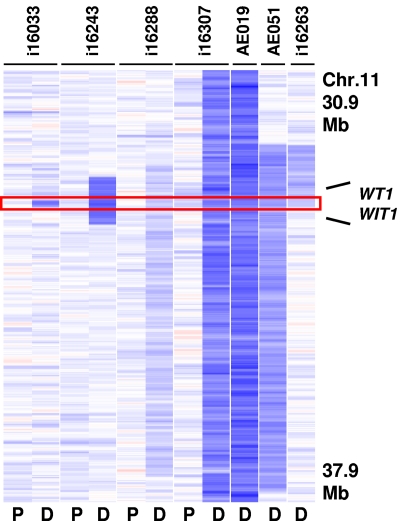
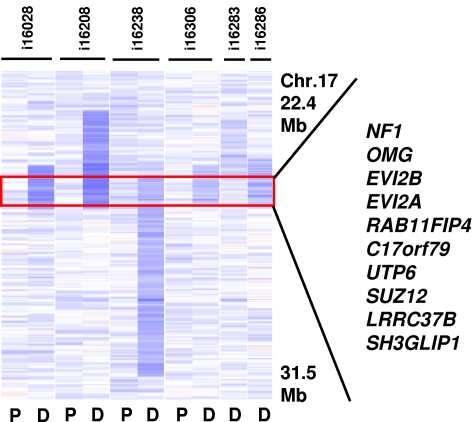
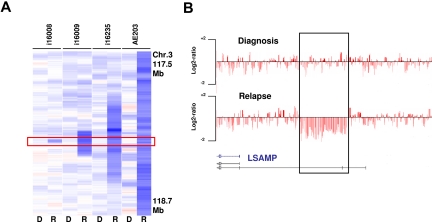
To identify cooperating lesions in core-binding factor acute myeloid leukemia, we performed single-nucleotide polymorphism-array analysis on 300 diagnostic and 41 relapse adult and pediatric leukemia samples. We identified a mean of 1.28 copy number alterations per case at diagnosis in both patient populations. Recurrent minimally deleted regions (MDRs) were identified at 7q36.1 (7.7%), 9q21.32 (5%), 11p13 (2.3%), and 17q11.2 (2%). Approximately one-half of the 7q deletions were detectable only by single-nucleotide polymorphism-array analysis because of their limited size. Sequence analysis of MLL3, contained within the 7q36.1 MDR, in 46 diagnostic samples revealed one truncating mutation in a leukemia lacking a 7q deletion. Recurrent focal gains were identified at 8q24.21 (4.7%) and 11q25 (1.7%), both containing a single noncoding RNA. Recurrent regions of copy-neutral loss-of-heterozygosity were identified at 1p (1%), 4q (0.7%), and 19p (0.7%), with known mutated cancer genes present in the minimally altered region of 1p (NRAS) and 4q (TET2). Analysis of relapse samples identified recurrent MDRs at 3q13.31 (12.2%), 5q (4.9%), and 17p (4.9%), with the 3q13.31 region containing only LSAMP, a putative tumor suppressor. Determining the role of these lesions in leukemogenesis and drug resistance should provide important insights into core-binding factor acute myeloid leukemia.
Figures
References
-
- Swerdlow SH, Campo E, Harris NL, et al. WHO Classification of Tumours of Haematopoietic and Lymphoid Tissues. 4th Ed. Lyon, France: IARC Press; 2008.
-
- Schlenk RF, Benner A, Krauter J, et al. Individual patient data-based meta-analysis of patients aged 16 to 60 years with core binding factor acute myeloid leukemia: a survey of the German Acute Myeloid Leukemia Intergroup. J Clin Oncol. 2004;22(18):3741–3750. - PubMed
-
- Marcucci G, Mrozek K, Ruppert AS, et al. Prognostic factors and outcome of core binding factor acute myeloid leukemia patients with t(8;21) differ from those of patients with inv(16): a Cancer and Leukemia Group B study. J Clin Oncol. 2005;23(24):5705–5717. - PubMed
-
- Appelbaum FR, Kopecky KJ, Tallman MS, et al. The clinical spectrum of adult acute myeloid leukaemia associated with core binding factor translocations. Br J Haematol. 2006;135(2):165–173. - PubMed
Publication types
MeSH terms
Substances
Associated data
- Actions
Grants and funding
LinkOut - more resources
Full Text Sources
Other Literature Sources
Molecular Biology Databases
Miscellaneous
