. 2012 Apr;190(4):1433-45.
doi: 10.1534/genetics.111.135574. Epub 2012 Jan 10.

Gene genealogies within a fixed pedigree, and the robustness of Kingman's coalescent

Affiliations

Gene genealogies within a fixed pedigree, and the robustness of Kingman's coalescent

John Wakeley et al. Genetics. 2012 Apr.

Abstract

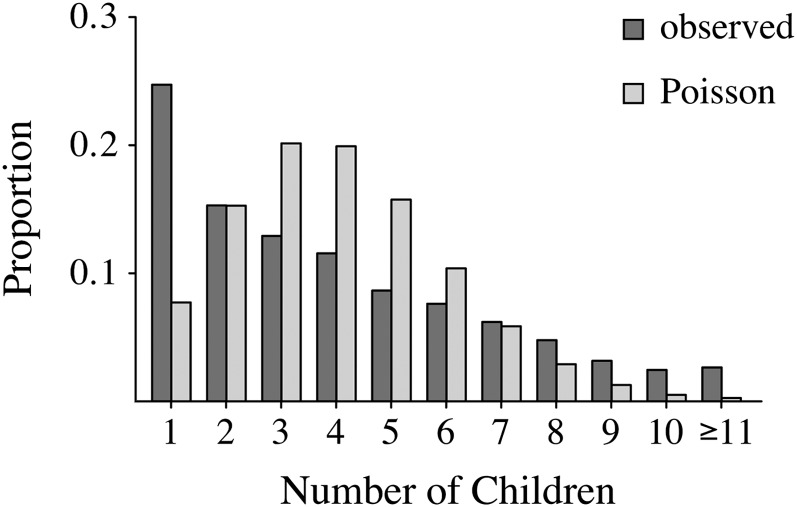
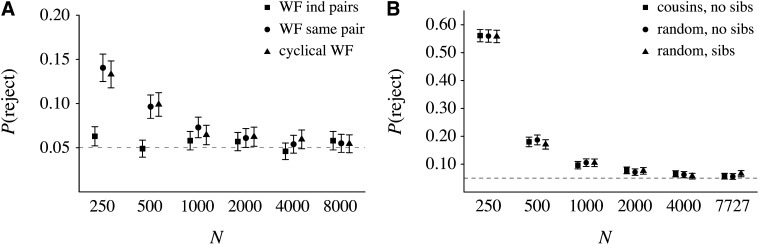
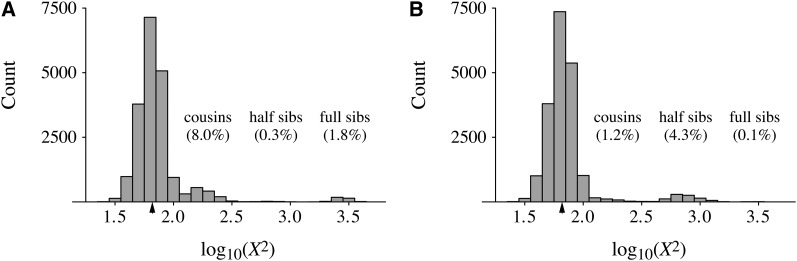
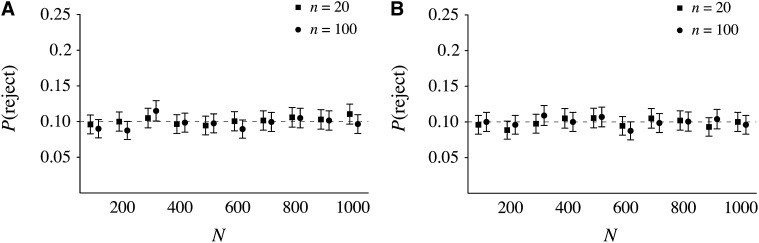
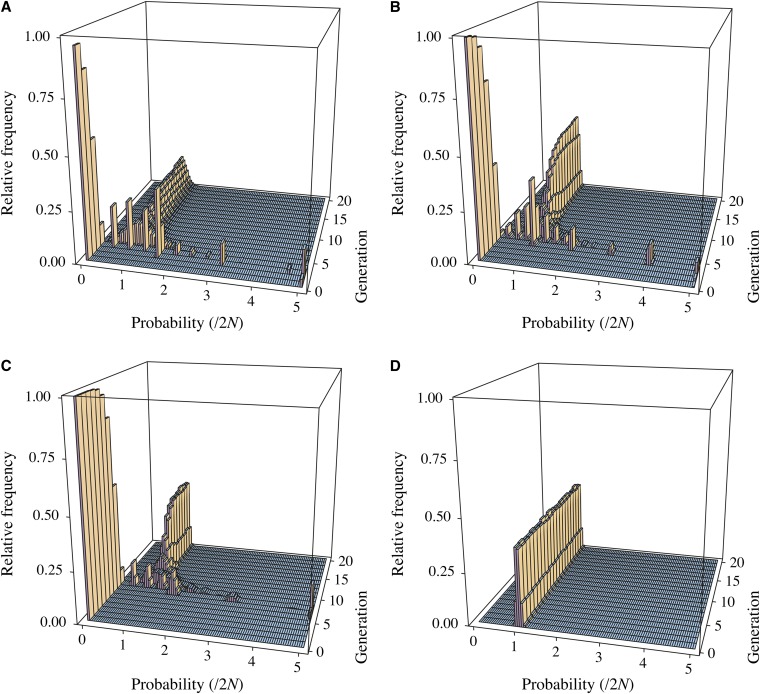
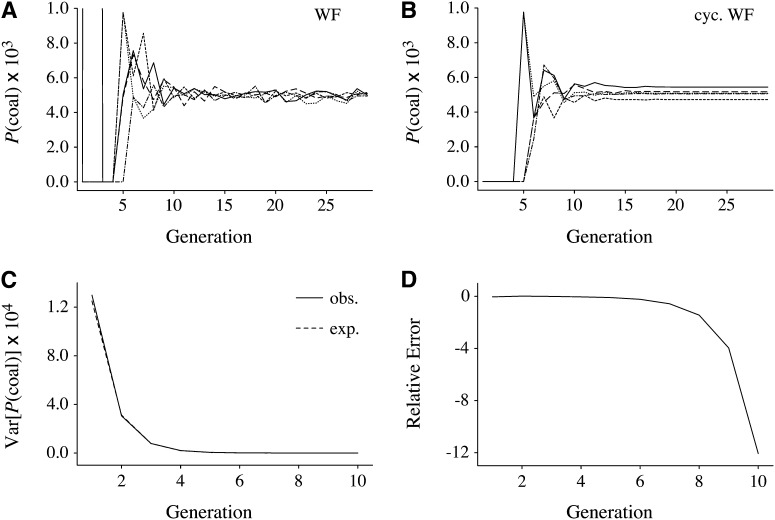
We address a conceptual flaw in the backward-time approach to population genetics called coalescent theory as it is applied to diploid biparental organisms. Specifically, the way random models of reproduction are used in coalescent theory is not justified. Instead, the population pedigree for diploid organisms--that is, the set of all family relationships among members of the population--although unknown, should be treated as a fixed parameter, not as a random quantity. Gene genealogical models should describe the outcome of the percolation of genetic lineages through the population pedigree according to Mendelian inheritance. Using simulated pedigrees, some of which are based on family data from 19th century Sweden, we show that in many cases the (conceptually wrong) standard coalescent model is difficult to reject statistically and in this sense may provide a surprisingly accurate description of gene genealogies on a fixed pedigree. We study the differences between the fixed-pedigree coalescent and the standard coalescent by analysis and simulations. Differences are apparent in recent past, within ≈ <log(2)(N) generations, but then disappear as genetic lineages are traced into the more distant past.


Figures

Figure 1
Figure 1
The observed distribution of the number of children of monogamous parents in the Swedish family data compared to a Poisson distribution with the same mean (∼3.95) and conditional on there being at least one child.
Figure 2
Figure 2
Probabilities of rejecting the Kingman coalescent using coalescence times on a fixed pedigree and the chi-square test described in the text. (A and B) The mean and estimated 95% confidence intervals for the probability of rejecting the coalescent using 1000 independent coalescence times, for a series of population sizes, under (A) three different Wright–Fisher pedigree models and (B) three different methods of building pedigrees from the Swedish family data. Dashed lines show the nominal significance level of the tests, which was 5%.
Figure 3
Figure 3
(A and B) Distributions of chi-square values (X2 on a log10 scale) among 20,000 randomly sampled pairs of individuals on (A) one pedigree from the Swedish family data containing 129 females and 123 males in each generation and (B) one Wright–Fisher pedigree containing 48 females and 48 males in each generation. The overall rejection probabilities were approximately the same for the two pedigrees: 0.535 vs. 0.529. Peaks in the right-hand tails are labeled by the relationship of the two sampled individuals, and the frequencies of each relationship among the 20,000 samples are given in parentheses. Minor differences in these frequencies occur among pedigrees (results not shown) but the overall patterns are robust. Triangles mark the chi-square cutoff for 5% significance.
Figure 4
Figure 4
Probabilities of rejecting the Kingman coalescent using 10-locus data from a fixed pedigree and Tajimas’s D. (A and B) The mean and estimated 95% confidence intervals for the probability of rejecting the coalescent using Tajima’s D at 10 independent loci, for different sample sizes and population sizes, when the expected number of pairwise differences is equal to one, for (A) one-generation cyclical Wright–Fisher pedigrees and (B) pedigrees from the Swedish family data. Dashed lines show the nominal significance level of the test, which was 10%.
Figure 5
Figure 5
Three-dimensional histograms of the probability that a sample of size two coalesces in each of the past 20 generations (g) on fixed Wright–Fisher pedigrees, for three different population sizes: (A) N = 102, (B) N = 103, and (C) N = 105. Within each generation, histograms show the relative frequency of the coalescence probability among 10,000 pedigrees. (D) These distributions for the case of independent samples from a geometric distribution with parameter 1/(2N), with N = 105 as in C.
Figure 6
Figure 6
Numerical analysis and simulations of pairwise coalescence probabilities in past generations. (A and B) The probabilities of coalescence for a sample of size n = 2 from a population of size 1000 at each generation in the past given no coalescence up to that generation, computed analytically using Equation 3 for five Wright–Fisher and five cyclical Wright–Fisher pedigrees, respectively. (C and D) Comparison of analytical and simulation results for the variance of the probability of coalescence in each generation in the past for a population of size N = 500. C shows both the expectated variances (exp.) given by Equation 4 and the observed variances (obs.) among 100,000 simulated Wright–Fisher pedigrees. D shows the relative error, (obs. – exp.)/exp., in each generation for the same data as in C.

References

    1. Ball M., Neigel J. E., Avise J. C., 1990. Gene genealogies within organismal pedigrees of random-mating populations. Evolution 44: 360–370 - PubMed
    1. Barton N. H., Etheridge A. M., 2011. The relationship between reproductive value and genetic contribution. Genetics 188: 953–973 - PMC - PubMed
    1. Bittles A. H., Egerbladh I., 2005. The influence of past endogamy and consanguinity on genetic disorders in northern Sweden. Ann. Hum. Genet. 69: 549–558 - PubMed
    1. Cannings C., 1974. The latent roots of certain Markov chains arising in genetics: a new approach. I. Haploid models. Adv. Appl. Probab. 6: 260–290
    1. Cannings C., Thompson E. A., Skolnick M. H., 1978. Probability functions on complex pedigrees. Adv. Appl. Probab. 10: 26–61