. 2012 Mar;22(3):446-55.
doi: 10.1101/gr.128652.111. Epub 2012 Jan 10.

HERC2 rs12913832 modulates human pigmentation by attenuating chromatin-loop formation between a long-range enhancer and the OCA2 promoter

Affiliations

HERC2 rs12913832 modulates human pigmentation by attenuating chromatin-loop formation between a long-range enhancer and the OCA2 promoter

Mijke Visser et al. Genome Res. 2012 Mar.

Abstract

Pigmentation of skin, eye, and hair reflects some of the most evident common phenotypes in humans. Several candidate genes for human pigmentation are identified. The SNP rs12913832 has strong statistical association with human pigmentation. It is located within an intron of the nonpigment gene HERC2, 21 kb upstream of the pigment gene OCA2, and the region surrounding rs12913832 is highly conserved among animal species. However, the exact functional role of HERC2 rs12913832 in human pigmentation is unknown. Here we demonstrate that the HERC2 rs12913832 region functions as an enhancer regulating OCA2 transcription. In darkly pigmented human melanocytes carrying the rs12913832 T-allele, we detected binding of the transcription factors HLTF, LEF1, and MITF to the HERC2 rs12913832 enhancer, and a long-range chromatin loop between this enhancer and the OCA2 promoter that leads to elevated OCA2 expression. In contrast, in lightly pigmented melanocytes carrying the rs12913832 C-allele, chromatin-loop formation, transcription factor recruitment, and OCA2 expression are all reduced. Hence, we demonstrate that allelic variation of a common noncoding SNP located in a distal regulatory element not only disrupts the regulatory potential of this element but also affects its interaction with the relevant promoter. We provide the key mechanistic insight that allele-dependent differences in chromatin-loop formation (i.e., structural differences in the folding of gene loci) result in differences in allelic gene expression that affects common phenotypic traits. This concept is highly relevant for future studies aiming to unveil the functional basis of genetically determined phenotypes, including diseases.


Figures
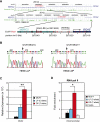
Figure 1.
Figure 1.
Characterization and suitability of the HEMn cell system: The OCA2 gene is differentially expressed in HEMn-LP and HEMn-DP cells. (A) UCSC Browser NCBI36/hg18 assembly (http://genome.ucsc.edu/cgi-bin/hgGateway?db=hg18) overview of the OCA2-HERC2 locus (top panel). (Middle panel) The region covered on BAC RP11-1365A12. Vertebrate conservation (green); the position of rs12913832 (red). (Lower panel) A schematic overview of the region investigated in this study. Restriction enzyme digestion sites are indicated. (B) Sequence analysis of the region around HERC2 rs12913832 in HEMn-LP (left) and HEMn-DP (right). The genotypes of rs12913832 were determined by direct sequencing of PCR fragments containing rs12913832. (C) RT-qPCR analysis of OCA2 primary transcripts in MCF7 and HEMn cells demonstrates differential OCA2 expression between HEMn-LP and HEMn-DP cells. Each gene expression analysis is carried out in triplicate and normalized to an endogenous reference gene (ACTB). (D) ChIP-qPCR of RNA Pol II binding at the OCA2 promoter in MCF7, HEMn-LP, and HEMn-DP cells. Enrichment is calculated relative to necdin (NDN), and values are normalized to input measurements. All ChIP analyses are performed in triplicate. Data are represented as mean ± SEM; (*) p < 0.05; (**) p < 0.01.
Figure 2.
Figure 2.
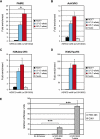
The region directly surrounding HERC2 rs12913832 acts as a melanocyte-specific enhancer. (A) Formaldehyde assisted identification of regulatory elements (FAIRE) demonstrates low nucleosome occupancy at the rs12913832 region in HEMn-LP and HEMn-DP cells. (B) ChIP-qPCR of acetylated histone H3 demonstrates active chromatin marks at the rs12913832 region in HEMn-LP and HEMn-DP cells. (C) ChIP-qPCR of histone H3 mono methylated on lysine 4 demonstrates that the rs12913832 region in HEMn-LP and HEMn-DP cells has enhancer potential. (D) ChIP-qPCR of histone H3 acetylated on lysine 27 demonstrates that the enhancer at the rs12913832 region in HEMn-LP and HEMn-DP cells is active. The enrichments displayed are relative to NDN. ChIP values for histone H3 marks are normalized to histone H3 occupancy. (E) Luciferase reporter assay demonstrates differential melanocyte enhancer activity for the rs12913832 region. The rs12913832 region from HEMn-LP (C-allele) and HEMn-DP (T-allele) was inserted into a luciferase reporter plasmid and transfected into HEK293 or G361 melanoma cells. Luciferase expression is normalized to Renilla luciferase expression. Data are represented as mean ± SEM; (*) p < 0.05; (***) p < 0.005.
Figure 3.
Figure 3.
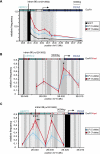
A chromatin loop is formed between the HERC2 rs12913832 enhancer region and the OCA2 promoter. (A–C) Locus-wide cross-linking frequencies observed in MCF7 (black), HEMn-LP (cyan), and HEMn-DP (red) cells. The analyzed region of the human OCA2-HERC2 locus is depicted on the top of each graph. The x-axis shows the approximate position on chromosome 15 (UCSC Browser NCBI36/hg18 assembly; see also Fig. 1A). (Black shading) The position and size of the “fixed” restriction fragment; (gray shading) position and size of other restriction fragments analyzed. (Black vertical bars in the locus graph) EcoRI sites; (red vertical bars) ApoI sites. The cross-linking frequencies are normalized to the highest interaction within an experiment. (A) Cross-linking frequencies for an EcoRI restriction fragment containing rs12913832 in MCF7 and HEMn cells. In HEMn cells, high cross-linking frequencies are observed for a restriction fragment containing the OCA2 promoter. (B) Cross-linking frequencies for an ApoI restriction fragment containing rs12913832 in HEMn cells. In HEMn cells, high cross-linking frequencies are observed for a restriction fragment containing the OCA2 promoter. Cross-linking frequencies between the restriction fragment containing rs12913832 and the restriction fragment containing the OCA2 promoter are higher for the T-allele (red) than for the C-allele (cyan). (C) Cross-linking frequencies for an ApoI restriction fragment containing the OCA2 promoter in HEMn cells. High cross-linking frequencies with restriction fragments surrounding the rs12913832 enhancer region are observed in HEMn cells. Cross-linking frequencies between the restriction fragment containing rs12913832 and the restriction fragment containing the OCA2 promoter are higher for the T-allele (red) than for the C-allele (cyan). Data are represented as mean ± SEM; (*) p < 0.05; (**) p < 0.01; (***) p < 0.005.
Figure 4.
Figure 4.
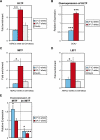
The HERC2 rs12913832 enhancer is regulated by the transcription factors HLTF, MITF, and LEF1. (A) ChIP-qPCR of HLTF at the rs12913832 region in HEMn-LP (C-allele) and HEMn-DP (T-allele) cells. HLTF binding is only observed for the T-allele. (B) Overexpression of HLTF in HEMn-DP cells results in increased OCA2 expression but not in HEMn-LP cells. (C) ChIP-qPCR of MITF at the HERC2 rs12913832 region in HEMn-LP (C-allele) and HEMn-DP (T-allele) cells. MITF binding is only observed for the T-allele. (D) ChIP-qPCR of LEF1 at the HERC2 rs12913832 region in HEMn-LP (C-allele) and HEMn-DP (T-allele) cells. LEF1 binding is only observed for the T-allele. ChIP enrichments displayed are relative to NDN. (E) Overexpression of MITF in HEMn-LP cells results in increased OCA2 expression. This is not observed in HEMn-DP cells. Overexpression of a dominant negative MITF (dnMITF) results in decreased OCA2 expression in both HEMn-LP and HEMn-DP cells. Expression is relative to ACTB expression and nontransfected control cells. Data are represented as mean ± SEM; (*) p < 0.05; (**) p < 0.01; (***) p < 0.005.
Figure 5.
Figure 5.
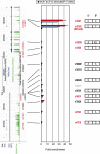
FAIRE analysis of pigmentation-associated SNPs other than HERC2 rs12913832 present within the 3′HERC2/5′OCA2 region does not reveal additional regulatory elements. (Left side) Tracks from the UCSC Browser (NCBI36/hg18 assembly; http://genome.ucsc.edu/cgi-bin/hgGateway?db=hg18) of the investigated 3′HERC2/5′OCA2 region. Pigmentation-associated SNPs (red); linked SNPs (r2 > 0.8) (black). The approximate location of the analyzed PCR amplicons is indicated. (Right side) The genotype of each SNP for HEMn-LP and HEMn-DP. The enrichments displayed are relative to NDN. Data are represented as mean ± SEM.
Figure 6.
Figure 6.
The chromatin loop between the HERC2 rs12913832 enhancer region and the OCA2 promoter is not caused by allelic differences in the 5′ region of OCA2. (A) Schematic overview of the allele-specific 3C assay. The allele-specific interaction between an ApoI fragment containing HERC2 rs12913832 and an ApoI fragment containing OCA2 rs4778241 is investigated. The presence of the C-allele of rs4778241 generates an additional MfeI restriction site. Primers 1 and 3 are used to detect the 3C product, while primers 2 and 3 are used to normalize the ratio of the A-allele over the C-allele. Ratios are determined by MfeI digestion of PCR products. The additional MfeI site is used to monitor the completeness of digestion. (B) Example of gel images of a representative MfeI digestion of PCR products. In the digested lane, the top band represents the A-allele and the bottom band the C-allele of rs4778241. (C) Quantification of multiple gel images as shown in B. The ratio of the bands generated by primer pair 2 + 3 after MfeI digestion is set to 1. Data are represented as mean ± SEM.

Comment in

Similar articles

Cited by

References

    1. Ahmadiyeh N, Pomerantz MM, Grisanzio C, Herman P, Jia L, Almendro V, He HH, Brown M, Liu XS, Davis M, et al. 2010. 8q24 prostate, breast, and colon cancer risk loci show tissue-specific long-range interaction with MYC. Proc Natl Acad Sci 107: 9742–9746 - PMC - PubMed
    1. Branicki W, Brudnik U, Wojas-Pelc A 2009. Interactions between HERC2, OCA2 and MC1R may influence human pigmentation phenotype. Ann Hum Genet 73: 160–170 - PubMed
    1. Branicki W, Liu F, van Duijn K, Draus-Barini J, Pospiech E, Walsh S, Kupiec T, Wojas-Pelc A, Kayser M 2011. Model-based prediction of human hair color using DNA variants. Hum Genet 129: 443–454 - PMC - PubMed
    1. Brilliant MH 2001. The mouse p (pink-eyed dilution) and human P genes, oculocutaneous albinism type 2 (OCA2), and melanosomal pH. Pigment Cell Res 14: 86–93 - PubMed
    1. Coetzee GA, Jia L, Frenkel B, Henderson BE, Tanay A, Haiman CA, Freedman ML 2010. A systematic approach to understand the functional consequences of non-protein coding risk regions. Cell Cycle 9: 256–259 - PMC - PubMed

Publication types

MeSH terms