

Quantile-specific penetrance of genes affecting lipoproteins, adiposity and height
- PMID: 22235250
- PMCID: PMC3250394
- DOI: 10.1371/journal.pone.0028764
Quantile-specific penetrance of genes affecting lipoproteins, adiposity and height
Abstract
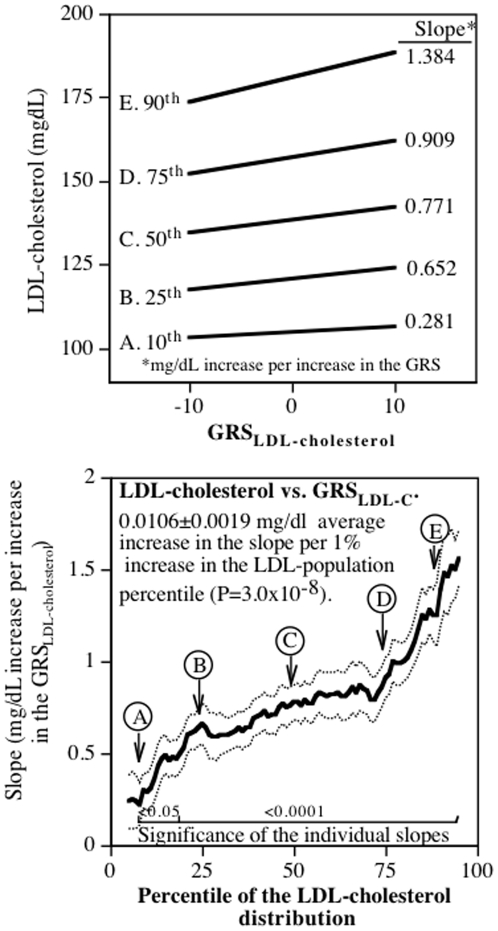
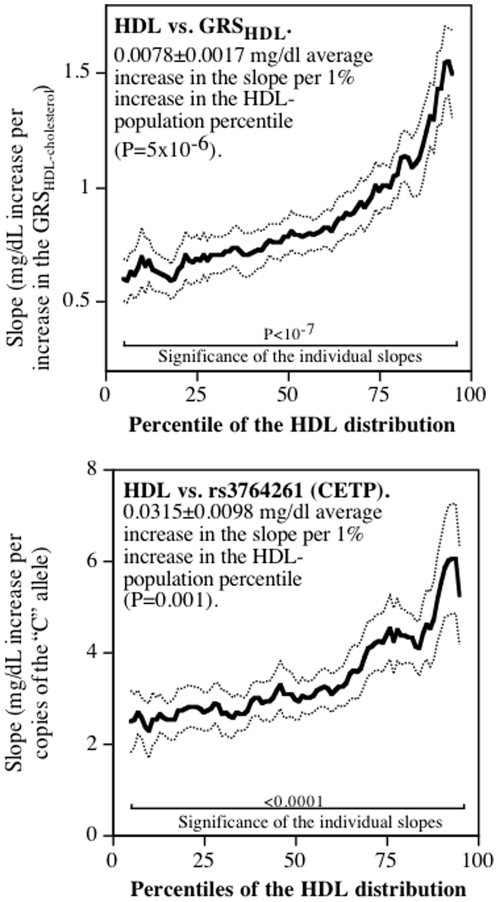
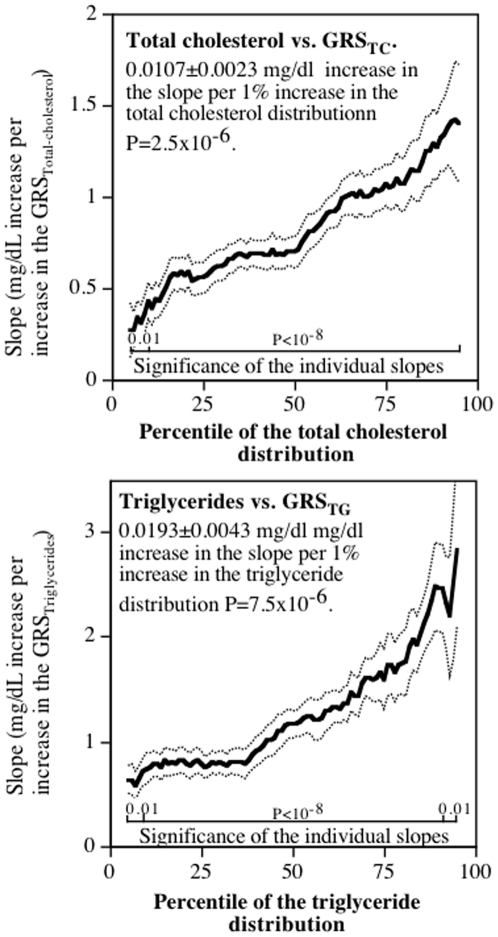
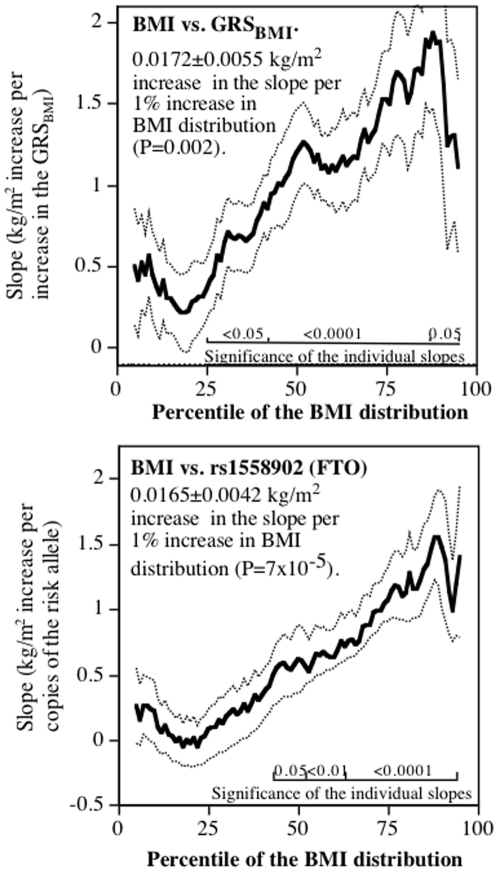
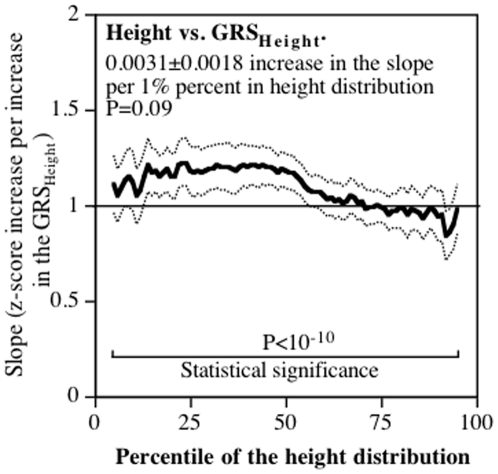
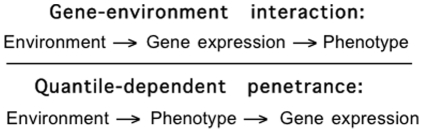
Quantile-dependent penetrance is proposed to occur when the phenotypic expression of a SNP depends upon the population percentile of the phenotype. To illustrate the phenomenon, quantiles of height, body mass index (BMI), and plasma lipids and lipoproteins were compared to genetic risk scores (GRS) derived from single nucleotide polymorphisms (SNP)s having established genome-wide significance: 180 SNPs for height, 32 for BMI, 37 for low-density lipoprotein (LDL)-cholesterol, 47 for high-density lipoprotein (HDL)-cholesterol, 52 for total cholesterol, and 31 for triglycerides in 1930 subjects. Both phenotypes and GRSs were adjusted for sex, age, study, and smoking status. Quantile regression showed that the slope of the genotype-phenotype relationships increased with the percentile of BMI (P = 0.002), LDL-cholesterol (P = 3×10⁻⁸), HDL-cholesterol (P = 5×10⁻⁶), total cholesterol (P = 2.5×10⁻⁶), and triglyceride distribution (P = 7.5×10⁻⁶), but not height (P = 0.09). Compared to a GRS's phenotypic effect at the 10(th) population percentile, its effect at the 90(th) percentile was 4.2-fold greater for BMI, 4.9-fold greater for LDL-cholesterol, 1.9-fold greater for HDL-cholesterol, 3.1-fold greater for total cholesterol, and 3.3-fold greater for triglycerides. Moreover, the effect of the rs1558902 (FTO) risk allele was 6.7-fold greater at the 90(th) than the 10(th) percentile of the BMI distribution, and that of the rs3764261 (CETP) risk allele was 2.4-fold greater at the 90(th) than the 10(th) percentile of the HDL-cholesterol distribution. Conceptually, it maybe useful to distinguish environmental effects on the phenotype that in turn alters a gene's phenotypic expression (quantile-dependent penetrance) from environmental effects affecting the gene's phenotypic expression directly (gene-environment interaction).
Conflict of interest statement
Figures
References
-
- Goldstein DB. Common genetic variation and human traits. N Engl J Med. 2009;360:1696–1698. - PubMed
-
- Draper NR, Smith H. Applied Regression Analysis. John Wiley and Sons; 1998. 736 ISBN: 9780471170822.
