. 2012;7(1):e28918.
doi: 10.1371/journal.pone.0028918. Epub 2012 Jan 3.

FcγRIIIa expression on monocytes in rheumatoid arthritis: role in immune-complex stimulated TNF production and non-response to methotrexate therapy

Collaborators, Affiliations

FcγRIIIa expression on monocytes in rheumatoid arthritis: role in immune-complex stimulated TNF production and non-response to methotrexate therapy

Dawn L Cooper et al. PLoS One. 2012.

Abstract

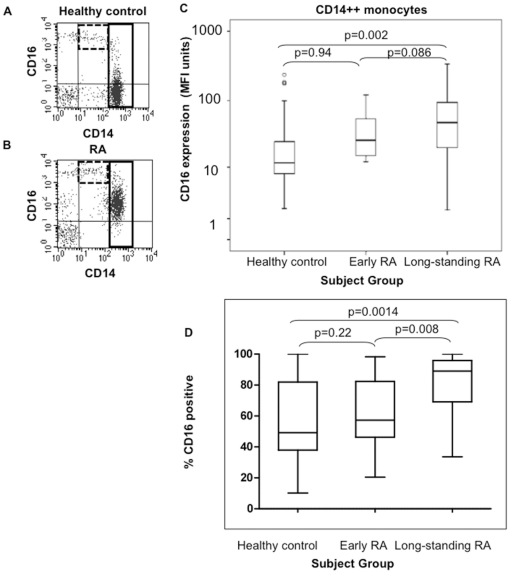
Objective: The expression of FcγRIIIa/CD16 may render monocytes targets for activation by IgG-containing immune complexes (IC). We investigated whether FcγRIIIa/CD16 was upregulated in rheumatoid arthritis (RA), associated with TNF production in response to IC-stimulation, and if this predicted response to methotrexate therapy.

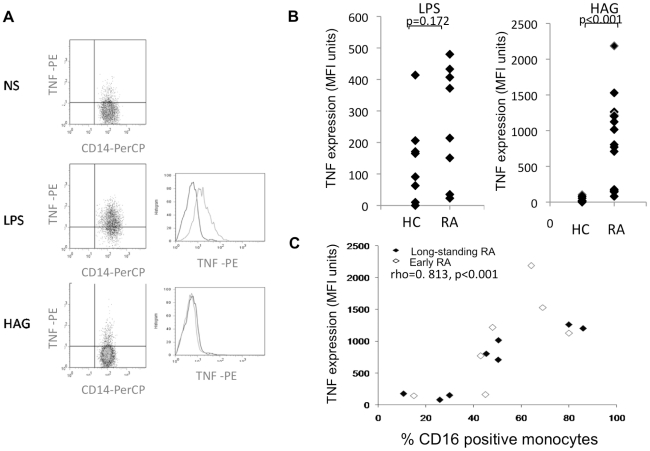
Methods: FcγRIIIa/CD16 expression on CD14(low) and CD14++ monocytes was measured by flow cytometry in healthy controls and RA patients (early and long-standing disease). Intracellular TNF-staining was carried out after in vitro LPS or heat-aggregated immunoglobulin (HAG) activation. FcγRIIIa/CD16 expression pre- and post-steroid/methotrexate treatment was examined.

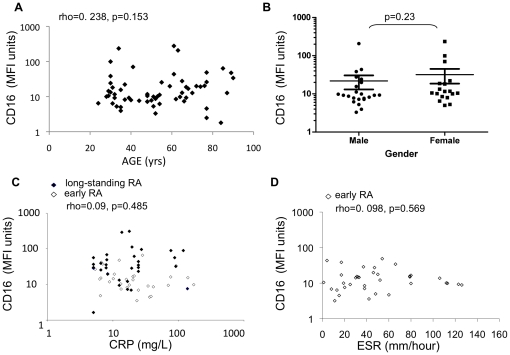
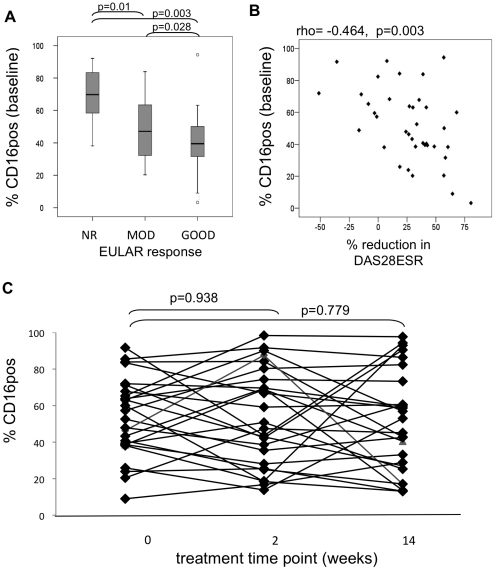
Results: Increased FcγRIIIa/CD16 expression on CD14++ monocytes in long-standing RA patients compared to controls was demonstrated (p = 0.002) with intermediate levels in early-RA patients. HAG-induced TNF-production in RA patients was correlated with the percentage of CD14++ monocytes expressing FcγRIIIa/CD16 (p<0.001). The percentage of CD14++ monocytes expressing FcγRIIIa/CD16 at baseline in early DMARD-naïve RA patients was negatively correlated with DAS28-ESR improvement 14-weeks post-methotrexate therapy (p = 0.003) and was significantly increased in EULAR non-responders compared to moderate (p = 0.01) or good responders (p = 0.003). FcγRIIIa/CD16 expression was not correlated with age, presence of systemic inflammation or autoantibody titers.

Conclusion: Increased FcγRIIIa/CD16 expression on CD14++ monocytes in RA may result in a cell that has increased responsiveness to IC-stimulation. This monocyte subset may contribute to non-response to methotrexate therapy.


Conflict of interest statement

Competing Interests: The authors have declared that no competing interests exist.

Figures

Figure 1
Figure 1. CD16 expression on peripheral blood monocytes in healthy control and RA patients.
Example flow cytometric analysis of peripheral blood monocytes from a single healthy control subject (A) and a long-standing RA patient (B). Monocytes were initially gated based on light forward and side scatter (gated on monocytes and the upper portion of lymphocytes). Within this population, monocyte subsets were distinguished by their staining with antibodies to CD14 and CD16. Examples of the separate gates created around the CD14low/CD16++ populations (dashed boxes) and the CD14++/CD16neg/low population (solid boxes) are shown. The same samples stained with anti-CD14-PerCP and IgG1-phycoerythrin (PE) isotype control in place of anti-CD16-PE were used to set gates. CD14neg/CD16++ cells were excluded from the CD14low/CD16++ based on gates set using staining with IgG2a-PerCP isotype control. (C) CD16 expression levels (MFI units) on CD14++ monocytes in control (n = 40), early RA (n = 42) and long-standing RA patients (n = 38). (D) Percentage of CD14++ monocytes expressing CD16 in the same healthy control, early RA and long-standing RA patients. Box plots represent median and upper and lower quartiles and dots represent outliers. Statistics; Mann-Whitney U test.
Figure 2
Figure 2. Correlation of age, gender, CRP and ESR with FcγRIIIa/CD16 expression on CD14++ monocytes.
(A) Healthy control subjects across a range of ages (x-axis) were tested for CD16 expression levels (MFI units, y-axis) on the CD14++ monocyte subset. (B) Healthy control subjects were stratified according to gender and levels of CD16 expression examined. (C) CRP levels in long-standing RA patients (closed points) and early RA patients (open points) were tested at the time of donating blood sample and examined for correlation with CD16 expression levels (MFI units, y-axis). (D) ESR values (x-axis) were measured in early RA patients only and examined for correlation with CD16 expression level (MFI units, y-axis). Statistics; Spearman's correlation.
Figure 3
Figure 3. TNF Intracellular staining in CD14 positive monocytes from healthy control and RA patients.
A) Thawed A) Cryopreserved PBMC from control and RA patients were stimulated for 4hrs with LPS (1 µg/ml), heat-aggregated Ig [HAG] (100 µg/ml) or the absence of stimulation (NS). Representative dot plots/histograms are shown for all treatments in a HC individual and for HAG stimulation in a RA patient (bottom panel). Intracellular staining was performed using anti-human TNF-PE or isotype control-PE antibodies and MFI units of expression measured. B) Intracellular staining for TNF in response to LPS (left panel) and HAG (right panel) in healthy control (HC, n = 8) and RA (n = 15) subjects. C) Correlation between HAG-stimulated TNF intracellular staining and % CD16 positive monocytes in RA patients. The percentage of CD14++ monocytes expressing CD16 (x-axis) and the MFI of anti-TNF-PE expression (y-axis) were determined by flow cytometry. Open diamonds represent early RA patient and shaded diamonds represent long-standing RA patients. Correlation coefficient spearman's rho = 0·813, p<0.001.
Figure 4
Figure 4. Baseline characteristics of early RA patients prior to methotrexate therapy and correlations with CD16 expression.
CD16 expression levels were examined on CD14++ monocytes for correlations with baseline characteristics in a cohort of early RA patients prior to methotrexate therapy. Demographics examined were gender (A), age at baseline (B), smoking status (C), CCP autoantibody-positivity (D), RF-positivity (E), baseline DAS28ESR (F), disease duration at initiation of therapy (G), foot erosions (H), hand erosions (I) and FCGR3A genotype (J). Relationships between these baseline characteristics and EULAR responses are shown in Table 1.
Figure 5
Figure 5. FcγRIIIa/CD16 expression on RA CD14++ monocytes pre- and post- methotrexate therapy.
A) The percentage of CD16 positive CD14++ monocytes was measured at baseline (y-axis) and correlated with patient responses to methotrexate treatment. Patients were classified at week 14 post-initiation of therapy as non-responders (NR, n = 12), moderate (MOD, n = 12) or good (GOOD, n = 15) according to EULAR criteria and compared using Mann Whitney U test. Dots represent outliers. (B) The percentage reduction in DAS28-ESR between 0 and 14 weeks post-initiation of therapy (x-axis) and the % of CD14++ cells expressing CD16 at baseline (y-axis). Negative levels indicate increased DAS28ESR between baseline and week 14. Statistics; Spearman's correlation. C) The percentage of CD16 positive CD14++ monocytes was measured at baseline (wk0), 2 and 14 weeks after initiation of steroid/methotrexate treatment in early DMARD-naïve RA patients. Samples at 2 weeks mainly reflect influence of steroid treatment whereas week 14 samples will mainly reflect the effect of methotrexate therapy. Wilcoxon signed ranks test used to compare paired samples pre- and post- therapy.

References

    1. Edwards JCW. Bird HA, Snaith M, editors. Is rheumatoid factor relevant? Questions and uncertainties in rheumatoid arthritis. 1998.
    1. Mewar D, Wilson AG. Autoantibodies in rheumatoid arthritis: a review. Biomed Pharmacother. 2006;60:648–655. - PubMed
    1. Nimmerjahn F, Ravetch JV. Fc-receptors as regulators of immunity. Adv Immunol. 2007;96:179–204. - PubMed
    1. Nimmerjahn F, Ravetch JV. Fc gamma receptors as regulators of immune responses. Nat Rev Immunol. 2008;8:34–47. - PubMed
    1. Dijstelbloem HM, van de Winkel JGJ, Kallenberg CGM. Inflammation in autoimmunity: receptors for IgG revisited. Trends Immunol. 2001;22:510–516. - PubMed

Publication types

MeSH terms