The characteristics of blood glucose and WBC counts in peripheral blood of cases of hand foot and mouth disease in China: a systematic review
- PMID: 22235257
- PMCID: PMC3250408
- DOI: 10.1371/journal.pone.0029003
The characteristics of blood glucose and WBC counts in peripheral blood of cases of hand foot and mouth disease in China: a systematic review
Abstract
Background: Outbreaks of Hand Foot and Mouth Disease (HFMD) have occurred in many parts of the world especially in China. We aimed to summarize the characteristics of the levels of blood glucose and white blood cell (WBC) counts in cases of HFMD in Mainland China and Taiwan, using meta-analysis based on systematic review of published articles.
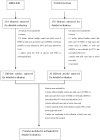
Methods: We systematically reviewed published studies, from the MEDLINE and WANFANG Data, about the levels of blood glucose and WBC counts in cases of HFMD until 15(th) June 2011, and quantitatively summarized the characteristics of them using meta-analysis.
Results: In total, 37 studies were included in this review. In Mainland China and Taiwan, generally, the average level of blood glucose, the prevalence of hyperglycemia, WBC counts and the prevalence of leukocytosis increased with the severity of the illness. There was no significant difference in the prevalence of leukocytosis between ANS (autonomic nervous system dysregulation)/PE (pulmonary edema) group and CNS (central nervous system) group, and in the average level of blood glucose between healthy controls and mild cases of HFMD. WBC counts in cases infected by EV71 were less than those in cases infected by CA16.
Conclusions: our analyses indicated that blood glucose and WBC counts increased with the severity of HFMD disease, which would help doctors to manage patients efficiently.
Conflict of interest statement
Figures


Similar articles
-
Influence of the Enterovirus 71 Vaccine and the COVID-19 Pandemic on Hand, Foot, and Mouth Disease in China Based on Counterfactual Models: Observational Study.JMIR Public Health Surveill. 2024 Dec 17;10:e63146. doi: 10.2196/63146. JMIR Public Health Surveill. 2024. PMID: 39692430 Free PMC article.
-
Systemic pharmacological treatments for chronic plaque psoriasis: a network meta-analysis.Cochrane Database Syst Rev. 2021 Apr 19;4(4):CD011535. doi: 10.1002/14651858.CD011535.pub4. Cochrane Database Syst Rev. 2021. Update in: Cochrane Database Syst Rev. 2022 May 23;5:CD011535. doi: 10.1002/14651858.CD011535.pub5. PMID: 33871055 Free PMC article. Updated.
-
What is the value of routinely testing full blood count, electrolytes and urea, and pulmonary function tests before elective surgery in patients with no apparent clinical indication and in subgroups of patients with common comorbidities: a systematic review of the clinical and cost-effective literature.Health Technol Assess. 2012 Dec;16(50):i-xvi, 1-159. doi: 10.3310/hta16500. Health Technol Assess. 2012. PMID: 23302507 Free PMC article.
-
Systemic pharmacological treatments for chronic plaque psoriasis: a network meta-analysis.Cochrane Database Syst Rev. 2017 Dec 22;12(12):CD011535. doi: 10.1002/14651858.CD011535.pub2. Cochrane Database Syst Rev. 2017. Update in: Cochrane Database Syst Rev. 2020 Jan 9;1:CD011535. doi: 10.1002/14651858.CD011535.pub3. PMID: 29271481 Free PMC article. Updated.
-
Antibody tests for identification of current and past infection with SARS-CoV-2.Cochrane Database Syst Rev. 2022 Nov 17;11(11):CD013652. doi: 10.1002/14651858.CD013652.pub2. Cochrane Database Syst Rev. 2022. PMID: 36394900 Free PMC article.
Cited by
-
Neurological complications and risk factors of cardiopulmonary failure of EV-A71-related hand, foot and mouth disease.Sci Rep. 2016 Mar 22;6:23444. doi: 10.1038/srep23444. Sci Rep. 2016. PMID: 27001010 Free PMC article.
-
Clinical characteristics of hand, foot and mouth disease in Daklak Province, Vietnam and associated factors of severe cases.Virusdisease. 2017 Dec;28(4):430-433. doi: 10.1007/s13337-017-0402-8. Epub 2017 Sep 20. Virusdisease. 2017. PMID: 29291236 Free PMC article.
-
A literature review and case report of hand, foot and mouth disease in an immunocompetent adult.BMC Res Notes. 2016 Mar 15;9:165. doi: 10.1186/s13104-016-1973-y. BMC Res Notes. 2016. PMID: 26975350 Free PMC article. Review.
-
Machine Learning Algorithms for Risk Prediction of Severe Hand-Foot-Mouth Disease in Children.Sci Rep. 2017 Jul 14;7(1):5368. doi: 10.1038/s41598-017-05505-8. Sci Rep. 2017. PMID: 28710409 Free PMC article.
-
A decade of sustained selection pressure on two surface sites of the VP1 protein of Enterovirus A71 suggests that immune evasion may be an indirect driver for virulence.Sci Rep. 2019 Apr 1;9(1):5427. doi: 10.1038/s41598-019-41662-8. Sci Rep. 2019. PMID: 30931960 Free PMC article.
References
-
- World Health Organization. A Guide to Clinical Management and Public Health Response for Hand, Foot and Mouth Disease (HFMD). World Health Organization Regional Office for the Western Pacific and the Regional Emerging Diseases Intervention (REDI) Centre. 2011:4–10, 38, 53–60.
-
- Mao GS, Luo L, Liu XL, Wang LC, Liu LF, et al. The comparison between mild cases and severe cases of hand-foot-mouth disease. Chin J Infect Dis. 2008;26(7):387–390.
Publication types
MeSH terms
Substances
LinkOut - more resources
Full Text Sources
Other Literature Sources
Medical
Molecular Biology Databases

