. 2012;7(1):e29082.
doi: 10.1371/journal.pone.0029082. Epub 2012 Jan 3.

Denervation causes fiber atrophy and myosin heavy chain co-expression in senescent skeletal muscle

Affiliations

Denervation causes fiber atrophy and myosin heavy chain co-expression in senescent skeletal muscle

Sharon L Rowan et al. PLoS One. 2012.

Abstract

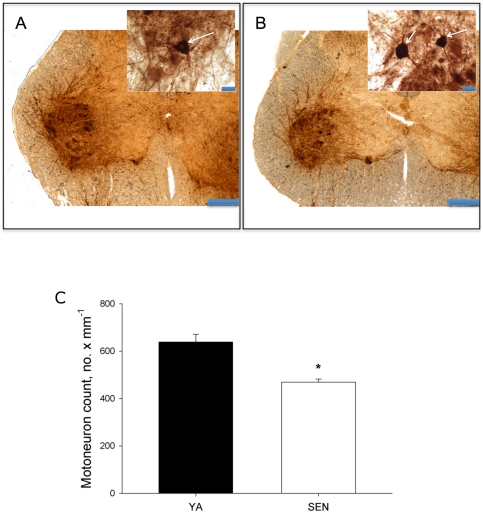
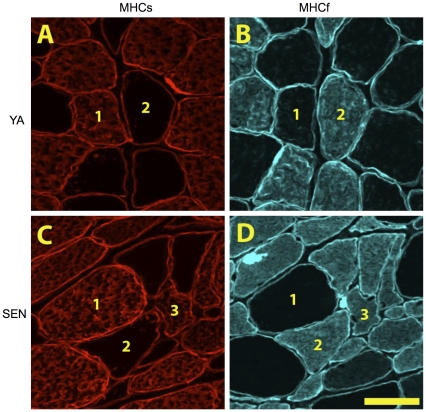
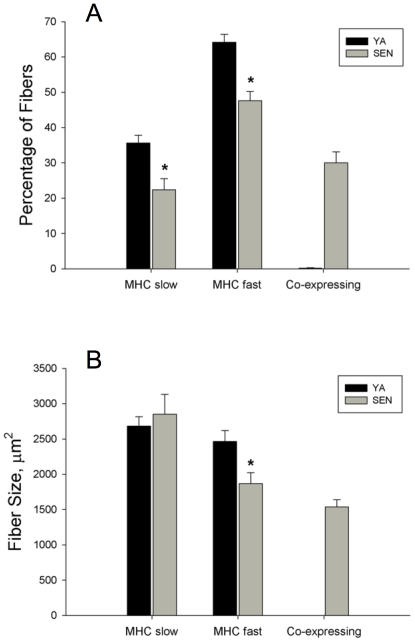
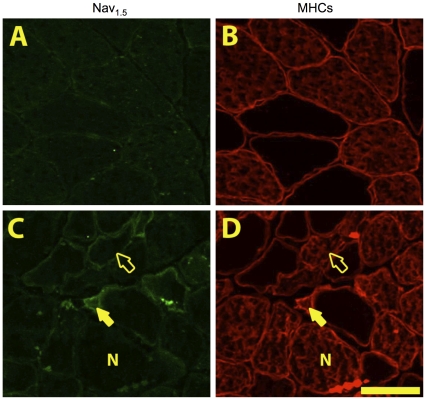
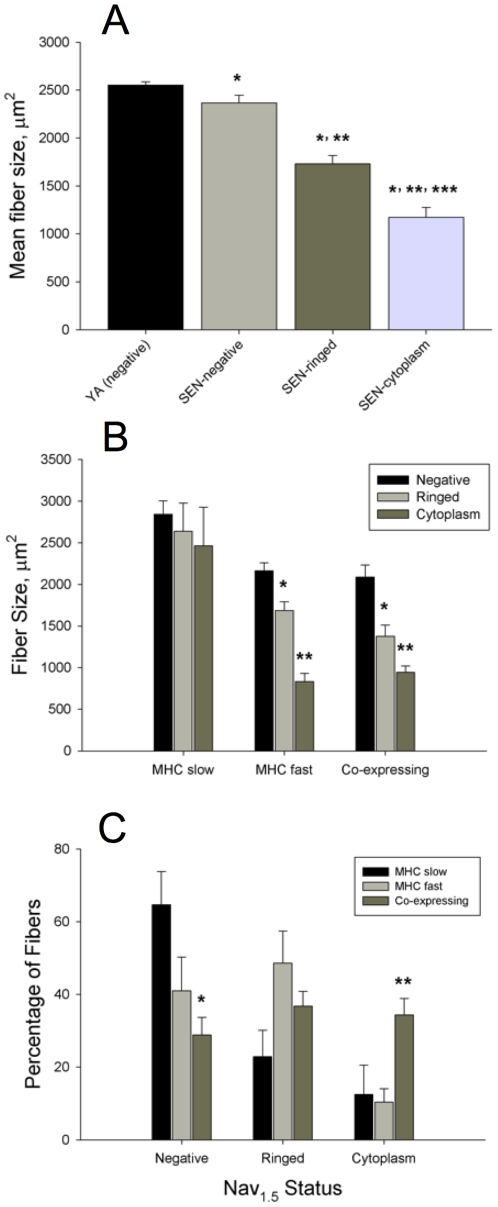
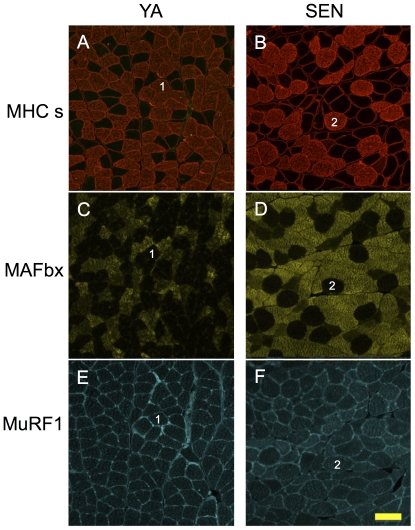
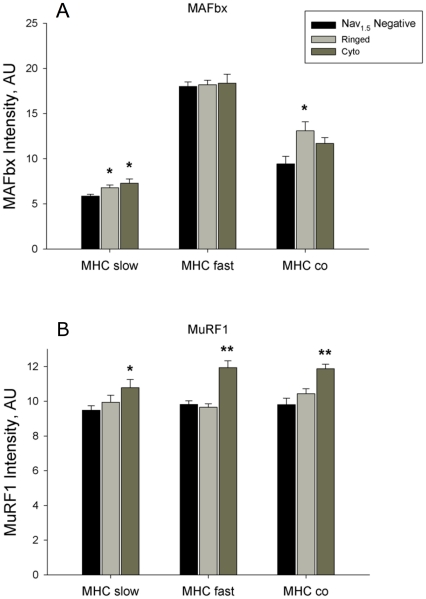
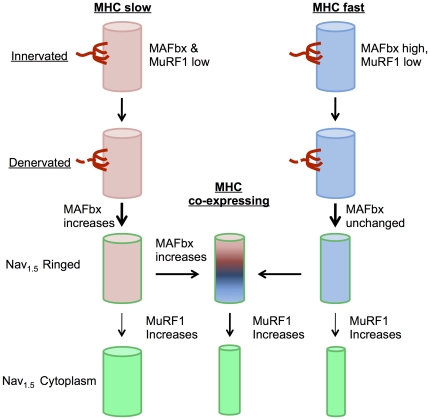
Although denervation has long been implicated in aging muscle, the degree to which it is causes the fiber atrophy seen in aging muscle is unknown. To address this question, we quantified motoneuron soma counts in the lumbar spinal cord using choline acetyl transferase immunhistochemistry and quantified the size of denervated versus innervated muscle fibers in the gastrocnemius muscle using the in situ expression of the denervation-specific sodium channel, Nav₁.₅, in young adult (YA) and senescent (SEN) rats. To gain insights into the mechanisms driving myofiber atrophy, we also examined the myofiber expression of the two primary ubiquitin ligases necessary for muscle atrophy (MAFbx, MuRF1). MN soma number in lumbar spinal cord declined 27% between YA (638±34 MNs×mm⁻¹) and SEN (469±13 MNs×mm⁻¹). Nav₁.₅ positive fibers (1548±70 μm²) were 35% smaller than Nav₁.₅ negative fibers (2367±78 μm²; P<0.05) in SEN muscle, whereas Nav₁.₅ negative fibers in SEN were only 7% smaller than fibers in YA (2553±33 μm²; P<0.05) where no Nav₁.₅ labeling was seen, suggesting denervation is the primary cause of aging myofiber atrophy. Nav₁.₅ positive fibers had higher levels of MAFbx and MuRF1 (P<0.05), consistent with involvement of the proteasome proteolytic pathway in the atrophy of denervated muscle fibers in aging muscle. In summary, our study provides the first quantitative assessment of the contribution of denervation to myofiber atrophy in aging muscle, suggesting it explains the majority of the atrophy we observed. This striking result suggests a renewed focus should be placed on denervation in seeking understanding of the causes of and treatments for aging muscle atrophy.


Conflict of interest statement

Competing Interests: The authors have declared that no competing interests exist.

Figures

Figure 1
Figure 1. Spinal cord motoneuron counts.
A: Photomicrograph of choline acetyl transferase labeled cross-sections of the spinal cord from a young adult rat and B: senescent rat (scale bar = 400 µm). Insets for both panels are higher power images showing motoneuron soma (arrows) (scale bar = 40 µm). C: mean motoneuron counts for young adult (YA) and senescent (SEN) rats. *P<0.05 versus YA.
Figure 2
Figure 2. Fiber type changes with aging.
Photomicrographs of serial sections labeled for myosin heavy chain (MHC) slow (A,C) and MHC fast (B,D) within the red region of gastrocnemius muscle from a young adult (A,B) and senescent (C,D) rat. In these images 1 denotes a MHCs fiber, 2 denotes a MHCf fiber, and 3 denotes a fiber co-expressing both MHCs and MHCf. Scale bar is 50 µm.
Figure 3
Figure 3. Fiber type proportion and fiber size in young adult (YA) and senescent (SEN) muscle.
Panel A depicts the percentage of fibers in each MHC class examined (*P<0.05 vs YA; too few MHC co-expressing fibers in YA to permit statistical comparison to SEN). Panel B depicts differences in fiber size according to each MHC class examined (*P<0.05 vs YA).
Figure 4
Figure 4. Alterations in myofiber Nav1.5 expression with aging.
Photomicrographs of serial sections of the red region of gastrocnemius muscle labeled for Nav1.5 (A,C) and MHC slow (B,D) in young adult (A,B) and senescent (C,D) rats. In senescent muscle we saw three classes of Nav1.5 labelling; negative (N), ringed (displaying circumferential labelling, open arrowhead) and cytoplasm (showing cytoplasmic staining, shaded arrowhead). Scale bar is 50 µm.
Figure 5
Figure 5. Fiber size in denervated versus innervated myofibers.
A: the mean fiber size of young adult (YA) myofibers where no Nav1.5 labeling was seen, versus Nav1.5 negative senescent (SEN) myofibers, Nav1.5 positive SEN ringed fibers, and Nav1.5 positive SEN cytoplasm fibers (*P<0.05 vs YA, **P<0.05 vs SEN negative, ***P<0.05 vs SEN ringed). B: the size of Nav1.5 positive fibers versus negative fibers according to the MHC labeling category in SEN muscle (*P<0.05 vs Nav1.5 negative, **P<0.05 vs ringed). C: the proportion of fibers within a given MHC labeling category that are Nav1.5 negative, Nav1.5 positive ringed, and Nav1.5 positive cytoplasm in SEN muscle (*P<0.05 vs MHC slow, **P<0.05 vs MHC slow and MHC fast).
Figure 6
Figure 6. In Situ myofiber ubiquitin ligase expression with aging.
Serial images of the red region of gastrocnemius muscle labeled for MHC slow (A,B), MAFbx (C,D) and MuRF1 (E,F) in young adult (YA) (A,C,E) and senescent (SEN) (B,D,F) rats. Fibers sharing the same number are the same fiber in serial sections. Scale bar is 100 µm.
Figure 7
Figure 7. Mean alterations in myofiber ubiquitin ligase expression with aging.
In situ expression levels of the ubiquitin ligases, MAFbx (A) and MuRF1 (B), in the red region of senescent gastrocnemius muscle in fibers that are MHC slow, MHC fast, and MHC fast/slow co-expressors, in relation to their Nav1.5 labeling status (*P<0.05 versus Nav1.5 negative, **P<0.05 versus Nav1.5 negative and versus Nav1.5 ringed).
Figure 8
Figure 8. Schematic representation of atrophy in MHC slow versus MHC fast myofibers following denervation in aging muscle.
Thickness of arrow indicates relative proportion of fibers taking a given path. Briefly, upon denervation, MHC slow fibers exhibit increased MAFbx expression, followed by the majority of denervated fibers beginning to co-express MHC fast, coincident with initiation of atrophy. Upon denervation of MHC fast fibers, MAFbx is unchanged but atrophy is already seen, followed by a majority of denervated fibers beginning to co-express MHC slow. MuRF1 increases with prolonged duration of denervation in all MHC categories and is associated with further atrophy in MHC fast and MHC co-expressing myofibers.

References

    1. Hepple RT. Sci Aging Knowledge Environ 2003: pe31; 2003. Sarcopenia-A critical perspective.pe31 - PubMed
    1. Faulkner JA, Larkin LM, Claflin DR, Brooks SV. Age-related changes in the structure and function of skeletal muscles. Clinical and experimental pharmacology & physiology. 2007;34:1091–1096. - PubMed
    1. Edstrom E, Altun M, Bergman E, Johnson H, Kullberg S, et al. Factors contributing to neuromuscular impairment and sarcopenia during aging. Physiology & Behavior. 2007;92:129–135. - PubMed
    1. Gutmann E, Hanzlikova V. Motor unit in old age. Nature. 1966;209:921–922. - PubMed
    1. Tomlinson BE, Irving D. The numbers of limb motor neurons in the human lumbosacral cord throughout life. JNeurolSci. 1977;34:213–219. - PubMed

Publication types

MeSH terms