

Dynamic patterns of circulating seasonal and pandemic A(H1N1)pdm09 influenza viruses from 2007-2010 in and around Delhi, India
- PMID: 22235265
- PMCID: PMC3250412
- DOI: 10.1371/journal.pone.0029129
Dynamic patterns of circulating seasonal and pandemic A(H1N1)pdm09 influenza viruses from 2007-2010 in and around Delhi, India
Abstract
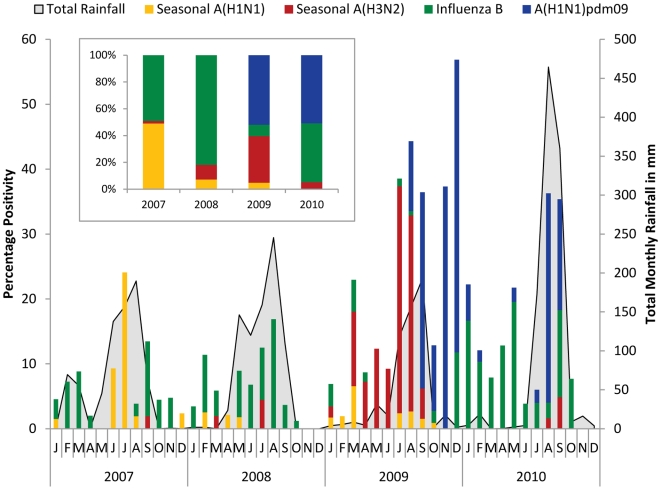
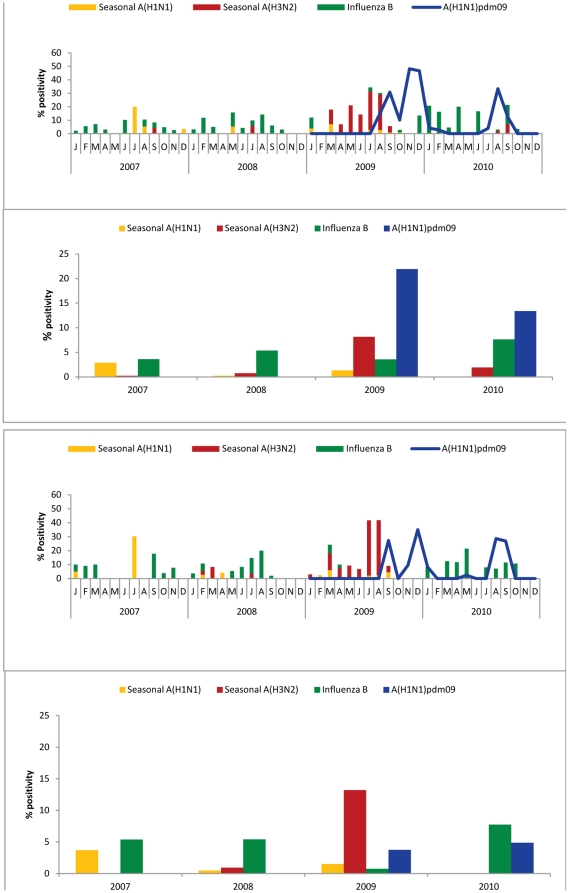
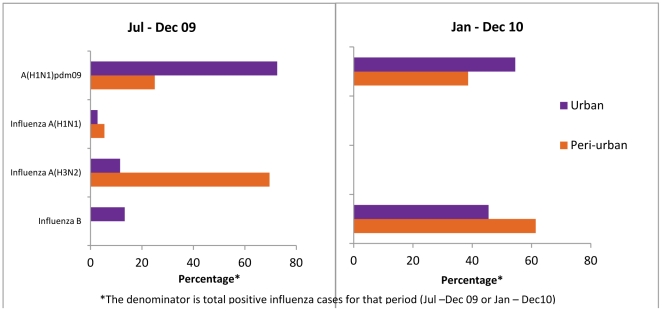
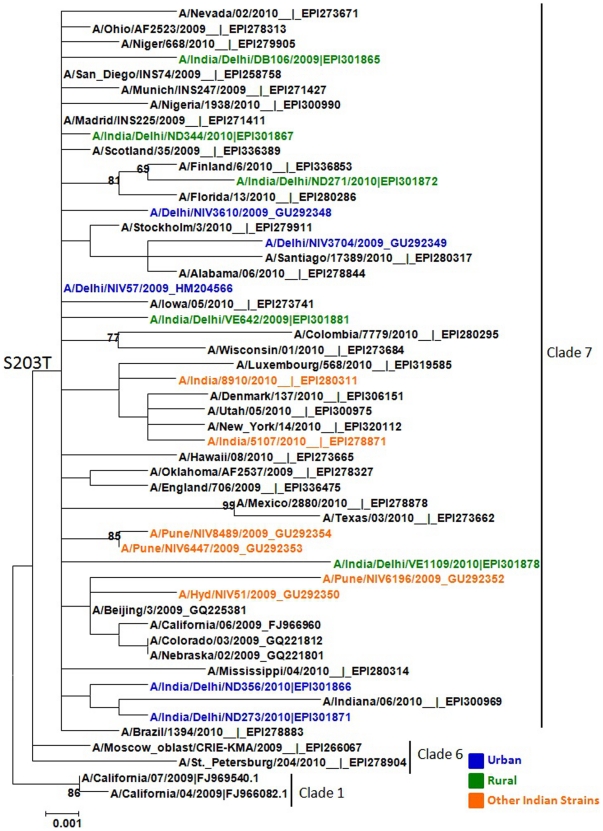
Influenza surveillance was carried out in a subset of patients with influenza-like illness (ILI) presenting at an Employee Health Clinic (EHS) at All India Institute of Medical Sciences (AIIMS), New Delhi (urban) and pediatric out patients department of civil hospital at Ballabhgarh (peri-urban), under the Comprehensive Rural Health Services Project (CRHSP) of AIIMS, in Delhi region from January 2007 to December 2010. Of the 3264 samples tested, 541 (17%) were positive for influenza viruses, of which 221 (41%) were pandemic Influenza A(H1N1)pdm09, 168 (31%) were seasonal influenza A, and 152 (28%) were influenza B. While the Influenza viruses were detected year-round, their types/subtypes varied remarkably. While there was an equal distribution of seasonal A(H1N1) and influenza B in 2007, predominance of influenza B was observed in 2008. At the beginning of 2009, circulation of influenza A(H3N2) viruses was observed, followed later by emergence of Influenza A(H1N1)pdm09 with co-circulation of influenza B viruses. Influenza B was dominant subtype in early 2010, with second wave of Influenza A(H1N1)pdm09 in August-September, 2010. With the exception of pandemic H1N1 emergence in 2009, the peaks of influenza activity coincided primarily with monsoon season, followed by minor peak in winter at both urban and rural sites. Age group analysis of influenza positivity revealed that the percent positivity of Influenza A(H1N1)pdm09 influenza virus was highest in >5-18 years age groups (OR 2.5; CI = 1.2-5.0; p = 0.009) when compared to seasonal influenza. Phylogenetic analysis of Influenza A(H1N1)pdm09 from urban and rural sites did not reveal any major divergence from other Indian strains or viruses circulating worldwide. Continued surveillance globally will help define regional differences in influenza seasonality, as well as, to determine optimal periods to implement influenza vaccination programs among priority populations.
Conflict of interest statement
Figures
Similar articles
-
[Influenza surveillance in five consecutive seasons during post pandemic period: results from National Influenza Center, Turkey].Mikrobiyol Bul. 2016 Jul;50(3):401-17. doi: 10.5578/mb.27775. Mikrobiyol Bul. 2016. PMID: 27525396 Turkish.
-
Emergence of 2009A/H1N1 cases in a tertiary care hospital in New Delhi, India.Influenza Other Respir Viruses. 2011 Nov;5(6):e552-7. doi: 10.1111/j.1750-2659.2011.00274.x. Epub 2011 Aug 4. Influenza Other Respir Viruses. 2011. PMID: 21816007 Free PMC article.
-
Impact of the 2009 H1N1 Pandemic on Age-Specific Epidemic Curves of Other Respiratory Viruses: A Comparison of Pre-Pandemic, Pandemic and Post-Pandemic Periods in a Subtropical City.PLoS One. 2015 Apr 30;10(4):e0125447. doi: 10.1371/journal.pone.0125447. eCollection 2015. PLoS One. 2015. PMID: 25928217 Free PMC article.
-
Spotlight influenza: Laboratory-confirmed seasonal influenza in people with acute respiratory illness: a literature review and meta-analysis, WHO European Region, 2004 to 2017.Euro Surveill. 2021 Sep;26(39):2000343. doi: 10.2807/1560-7917.ES.2021.26.39.2000343. Euro Surveill. 2021. PMID: 34596019 Free PMC article. Review.
-
Renal complications of seasonal and pandemic influenza A virus infections.Eur J Pediatr. 2013 Jan;172(1):15-22. doi: 10.1007/s00431-012-1854-x. Epub 2012 Oct 13. Eur J Pediatr. 2013. PMID: 23064728 Review.
Cited by
-
Impact of influenza A(H1N1)pdm09 virus on circulation dynamics of seasonal influenza strains in Kenya.Am J Trop Med Hyg. 2013 May;88(5):940-5. doi: 10.4269/ajtmh.12-0147. Epub 2013 Mar 4. Am J Trop Med Hyg. 2013. PMID: 23458953 Free PMC article.
-
The emergence and consistency of influenza strains causing influenza like illness in Himachal Pradesh, India.Virusdisease. 2016 Jun;27(2):130-5. doi: 10.1007/s13337-016-0312-1. Epub 2016 Apr 7. Virusdisease. 2016. PMID: 27366763 Free PMC article.
-
Atypical Influenza A(H3N2) Activity Patterns in Germany, 2021-2023, and Characterization of Newly Emerged Virus Clades.J Med Virol. 2025 Aug;97(8):e70530. doi: 10.1002/jmv.70530. J Med Virol. 2025. PMID: 40772603 Free PMC article.
-
Demographic shift of influenza A(H1N1)pdm09 during and after pandemic, rural India.Emerg Infect Dis. 2012 Sep;18(9):1472-5. doi: 10.3201/eid1809.111847. Emerg Infect Dis. 2012. PMID: 22932477 Free PMC article.
-
Considerations of strategies to provide influenza vaccine year round.Vaccine. 2015 Nov 25;33(47):6493-8. doi: 10.1016/j.vaccine.2015.08.037. Epub 2015 Aug 28. Vaccine. 2015. PMID: 26319745 Free PMC article. Review.
References
-
- World Health Organization. Acute Respiratory Infections: Influenza. 2007. Available: http://www.who.int/vaccine_research/diseases/ari/en/index.html. Accessed 15 March 2011.
-
- Simonsen L. The global impact of influenza on morbidity and mortality. Vaccine. 1999;17:S3–10. - PubMed
-
- Moura FA. Influenza in the tropics. Curr Opin Infect Dis. 2010;23:415–420. - PubMed
Publication types
MeSH terms
Grants and funding
LinkOut - more resources
Full Text Sources
Medical
