. 2012;7(1):e29641.
doi: 10.1371/journal.pone.0029641. Epub 2012 Jan 3.

Protective effects of a Rhodiola crenulata extract and salidroside on hippocampal neurogenesis against streptozotocin-induced neural injury in the rat

Affiliations

Protective effects of a Rhodiola crenulata extract and salidroside on hippocampal neurogenesis against streptozotocin-induced neural injury in the rat

Ze-qiang Qu et al. PLoS One. 2012.

Abstract

Previously we have demonstrated that a Rhodiola crenulata extract (RCE), containing a potent antioxidant salidroside, promotes neurogenesis in the hippocampus of depressive rats. The current study was designed to further investigate the protective effect of the RCE on neurogenesis in a rat model of Alzheimer's disease (AD) induced by an intracerebroventricular injection of streptozotocin (STZ), and to determine whether this neuroprotective effect is induced by the antioxidative activity of salidroside. Our results showed that pretreatment with the RCE significantly improved the impaired neurogenesis and simultaneously reduced the oxidative stress in the hippocampus of AD rats. In vitro studies revealed that (1) exposure of neural stem cells (NSCs) from the hippocampus to STZ strikingly increased intracellular reactive oxygen species (ROS) levels, induced cell death and perturbed cell proliferation and differentiation, (2) hydrogen peroxide induced similar cellular activities as STZ, (3) pre-incubation of STZ-treated NSCs with catalase, an antioxidant, suppressed all these cellular activities induced by STZ, and (4) likewise, pre-incubation of STZ-treated NSCs with salidroside, also an antioxidant, suppressed all these activities as catalase: reduction of ROS levels and NSC death with simultaneous increases in proliferation and differentiation. Our findings indicated that the RCE improved the impaired hippocampal neurogenesis in the rat model of AD through protecting NSCs by its main ingredient salidroside which scavenged intracellular ROS.


Conflict of interest statement

Competing Interests: The authors have declared that no competing interests exist.

Figures

Figure 1
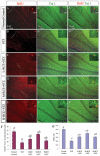
Figure 1. BrdU/Tuj1 double immunofluorescence labeling in the rat hippocampus.
(A–E, A′–E′, A″–E″) Representative photomicrographs of BrdU (red fluorescence in the nuclei, A–E) and Tuj1 labeling (green fluorescence in the cytoplasm, A′–E′; A″–E″ are merged images of BrdU and Tuj1 labeling) from different experimental groups: (A–A″) Normal control group, (B–B″) streptozotocin-treated (STZ) group, (C–C″) Low dose of RCE pre-treatment followed by STZ treatment group (L-RCE+STZ), (D–D″) Medium dose of RCE pre-treatment followed by STZ treatment group (M-RCE+STZ) and (E–E″) High dose of RCE pre-treatment followed by STZ treatment group (H-RCE+STZ). The upper right inset of the photomicrograph is the enlarged view of a double-labeled cell in the boxed area (arrow). (F) Bar chart showing the percentages of differentiating neurons (BrdU+Tuj1+/BrdU+×100%). (G) Bar chart showing BrdU-positive cell counts. Values are expressed as mean±SD. a: p<0.05 compared with the normal control group; b: p<0.05 compared with the STZ group.
Figure 2
Figure 2. Oxidative stress in the hippocampus of STZ-treated rats.
(A) Activities of glutathione reductase (GR). (B) Amounts of reduced glutathione (GSH). (C) Amounts of malondialdehyde (MDA). Values are expressed as means±SD. a: p<0.05 compared with the normal control group; b: p<0.05 compared with the STZ group. Normal Control: normal control group; STZ: streptozotocin-treated group; L-RCE+STZ, M-RCE+STZ and H-RCE+STZ: pre-treatment groups with low, medium and high concentrations of the R. crenulata extract (RCE), respectively, followed by STZ treatment.
Figure 3
Figure 3. Analytical HPLC chromatograms.
(A) R. crenulata extract (RCE); (B) salidroside control. Note that salidroside is the most abundant ingredient of the RCE.
Figure 4
Figure 4. HPLC chromatogram of salidroside.
Note that the preparation of salidroside is 100% pure.
Figure 5
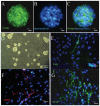
Figure 5. Neurosphere culture derived from the rat hippocampus.
(A–C) Neurosphere at the second passage is immunoreactive to nestin, a marker of neural stem cells (green), and counterstained by nuclear fluorescent stain Hoechst33342 (blue). (D) Hippocampal cells from newborn rats proliferated and aggregated to form neurospheres one week after cultured in the DMEM/F-12 serum-free medium supplemented with B27 and bFGF. (E–G) Cells from the neurospheres show positive immunoreactivity to Tuj1 (E), MOSP (F), and GFAP (G) (markers of differentiating neurons, oligodendrocytes and astroglia, respectively) one week after cultured in the differentiation medium (DMEM/F12+10% FBS).
Figure 6
Figure 6. Viability of NSCs, as assayed by the MTT, at various doses of STZ and salidroside.
(A) Cells from neurospheres at the second passage were incubated with various concentrations of STZ for 4 hr. STZ exhibits a dose-dependent cytotoxic effect on NSCs. (B) Salidroside at a concentration up to 2 mM for 12 hr shows no cytotoxic effects on NSCs. (C) Cells from neurospheres were pre-incubated with various concentrations of salidroside for 12 hr before exposure to 8 mM STZ. Salidroside at 1 or 2 mM exhibits significant protection against STZ-induced cytotoxity on NSCs. * p<0.05 compared with the control value without salidroside. Values are expressed as means±SD.
Figure 7
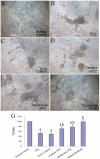
Figure 7. Cell morphology (A–F) and cell viability as measured by the MTT assay (G).
NSCs at the second passage were seeded on poly-L-lysine-coated culture plates and grouped for the following treatments: (A) Normal control group without any treatment; (B) STZ group treated with STZ for four hours; (C) H2O2 control group treated with H2O2 for four hours; (D) Catalase+STZ group treated with catalase for twelve hours followed by four-hour incubation with STZ; (E) Salidroside+STZ group treated with salidroside for twelve hours followed by four-hour incubation with STZ; (F) Salidroside blank group treated with salidroside for twelve hours. Values are expressed as mean±SD. a p<0.05 compared with the normal control group; b p<0.05 compared with the STZ group.
Figure 8
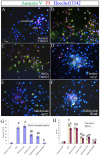
Figure 8. Annexin V and PI immunolabeling for detection of apoptosis and necrosis in NSCs, respectively.
(A–F) Representative fluorescence photomicrographs of NSCs immunoreactive to annexin V (green) and PI (red) with their nucleus counterstained with Hoechst33342 (blue) in six experimental groups: (A) Normal control group; (B) STZ group; (C) H2O2 control group; (D) Catalase+STZ group; (E) Salidroside+STZ group; (F) Salidroside blank group. Cell at early to intermediate stages of apoptosis are positive to Annexin V but negative to PI (open arrow); late apoptosis cells are PI positive with chromatin condensation; and necrotic cells are PI positive without chromatin condensation (solid arrow). (G) Bar chart showing the percentages of annexin V-positive cells which are at the early-to-intermediate stage of apoptosis. (H) Bar chart showing the percentages of PI-positive cells, indicating that they are either late apoptotic or necrotic cells. Values are expressed as mean±SD. Numbers within bars represent the actual numerical reading on the y-axis. a p<0.05 compared with the normal control group; b p<0.05 compared with the STZ group.
Figure 9
Figure 9. Immunofluorescence staining for cleaved caspase-3 (p17/19 active fragments) on NSCs.
(A–F, A′–F′, A″–F″) Representative photomicrographs of caspase-3 immunoreactive cells (A–F) with their nuclei counterstained by the blue fluorescent nuclear stain Hoechst33342 (A′–F′) in six experimental groups: (A-A″) Normal control group, (B-B″) STZ group, (C-C″) H2O2 control group, (D-D″) Catalase+STZ group, (E-E″) Salidroside+STZ group and (F-F″) Salidroside blank group. (G) Bar chart showing the percentages of caspase-3 immunoreactive cells. Values are expressed as mean±SD. Numbers within bars represent the actual numerical reading on the y-axis. a p<0.05 compared with the normal control group; b p<0.05 compared with the STZ group.
Figure 10
Figure 10. BrdU labeling in NSCs.
NSCs at P2 were labeled with BrdU (10 µM) for 4 h×3 times (three times each for 4 hours), and then immunofluorescently stained for BrdU. (A–F, A′–F′, A″–F″) Representative photomicrographs of BrdU labeled cells (red, A–F) with their nuclei counterstained by the nuclear fluorescent stain DAPI (blue, A′–F′) in six experimental groups: (A-A″) Normal control group, (B-B″) STZ group, (C-C″) H2O2 control group, (D-D″) Catalase+STZ group, (E-E″) Salidroside+STZ group and (F-F″) Salidroside blank group. (G) Bar chart showing the percentages of BrdU labeled cells. Values are expressed as mean±SD. a p<0.05 compared with the normal control group; b p<0.05 compared with the STZ group.
Figure 11
Figure 11. Immunofluorescence staining for MAP2, NF150 and Tuj1 in NSCs.
(A–R) Representative photomicrographs of immunoreactive cells (green, nuclei counterstained with blue fluorescent stain Hoechst33342) for MAP2 (A–F), NF150 (G–L) and Tuj1 (M–R) in six experimental groups: Normal control group (A, G, M), STZ group (B, H, N), H2O2 control group (C, I, O), Catalase+STZ group (D, J, P), Salidroside+STZ group (E, K, Q) and Salidroside blank group (F, L, R). (S) Bar chart showing the percentages of immunoreactive cells for MAP2, NF150 and Tuj1. (T) Bar chart showing the average length of cellular processes from NF150 immunoreactive cells. Values are expressed as mean±SD. a p<0.05 compared with the normal control group; b p<0.05 compared with the STZ group.
Figure 12
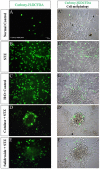
Figure 12. Detection of intracellular ROS with a fluorescent probe carboxy-H2DCFDA.
Representative photomicrographs showing ROS (reactive to the green fluorescent probe carboxy-H2DCFDA) within the cytoplasm of NSCs (A–E) and merged images showing both ROS immunoreactivity and cell morphology (A′–E′) in five experimental groups: Normal control group (A-A′), STZ group (B-B′), H2O2 control group (C-C′), Catalase+STZ group (D-D′) and Salidroside+STZ group (E-E′).

Similar articles

Cited by

References

    1. Guglielmotto M, Tamagno E, Danni O. Oxidative stress and hypoxia contribute to Alzheimer's disease pathogenesis: two sides of the same coin. Scientific World Journal. 2009;9:781–791. - PMC - PubMed
    1. Ziabreva I, Perry E, Perry R, Minger SL, Ekonomou A, et al. Altered neurogenesis in Alzheimer's disease. J Psychosom Res. 2006;61:311–316. - PubMed
    1. Drapeau E, Mayo W, Aurousseau C, Le Moal M, Piazza PV, et al. Spatial memory performances of aged rats in the water maze predict levels of hippocampal neurogenesis. Proc Natl Acad Sci U S A. 2003;100:14385–14390. - PMC - PubMed
    1. Mohapel P, Leanza G, Kokaia M, Lindvall O. Forebrain acetylcholine regulates adult hippocampal neurogenesis and learning. Neurobiol Aging. 2005;26:939–946. - PubMed
    1. Grundke-Iqbal I, Tatebayashi Y, Li L, Haque N, Iqbal K. Abnormalities in neurogenesis in Alzheimer disease. Neurobiol Aging. 2002;23:S563–S563.

Publication types

MeSH terms