. 2012 Jan 11:11:3.
doi: 10.1186/1476-4598-11-3.

Altered CXCR3 isoform expression regulates prostate cancer cell migration and invasion

Affiliations

Altered CXCR3 isoform expression regulates prostate cancer cell migration and invasion

Qian Wu et al. Mol Cancer. .

Abstract

Background: Carcinoma cells must circumvent the normally suppressive signals to disseminate. While often considered 'stop' signals for adherent cells, CXCR3-binding chemokines have recently been correlated positively with cancer progression though the molecular basis remains unclear.

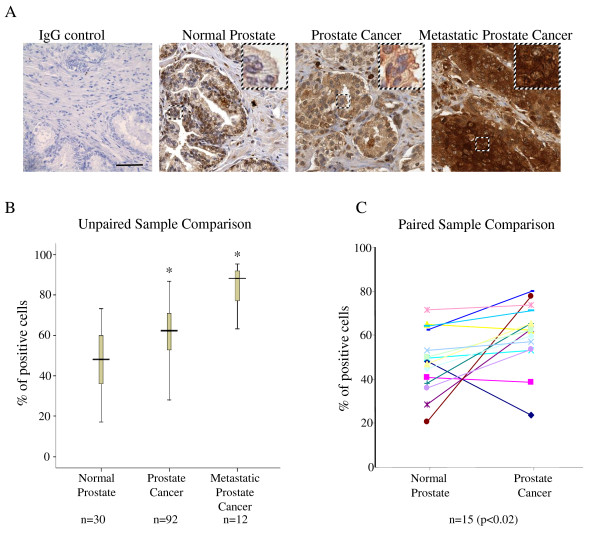
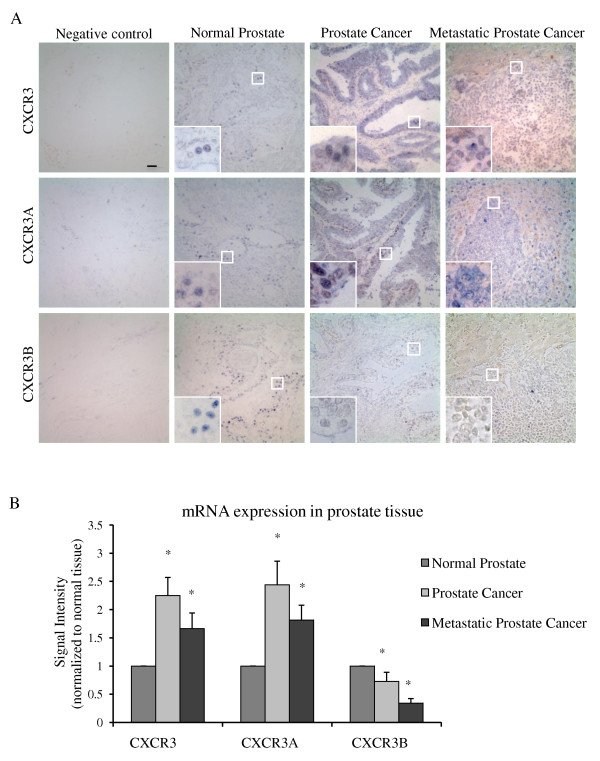
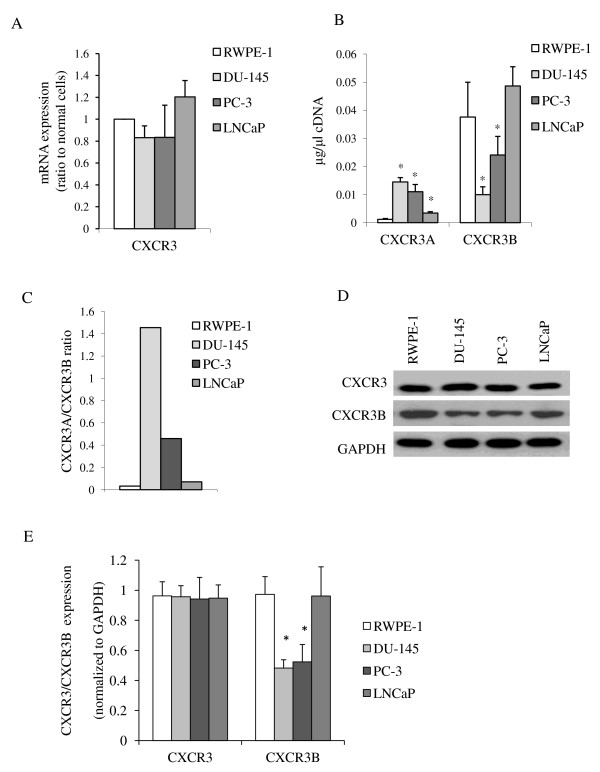
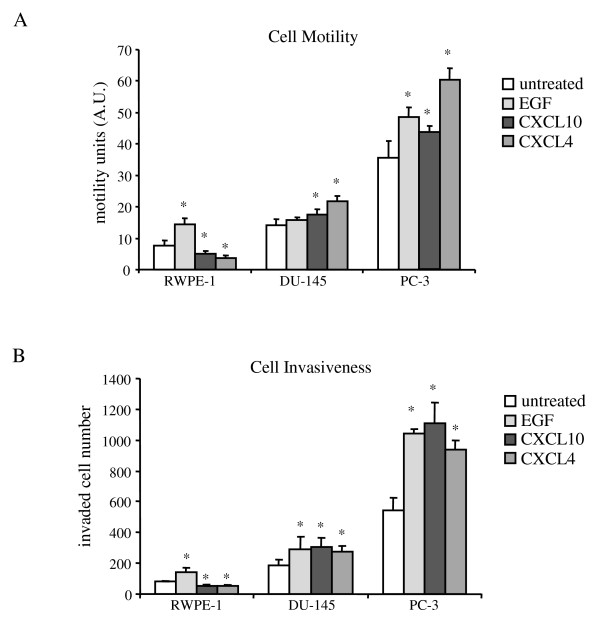
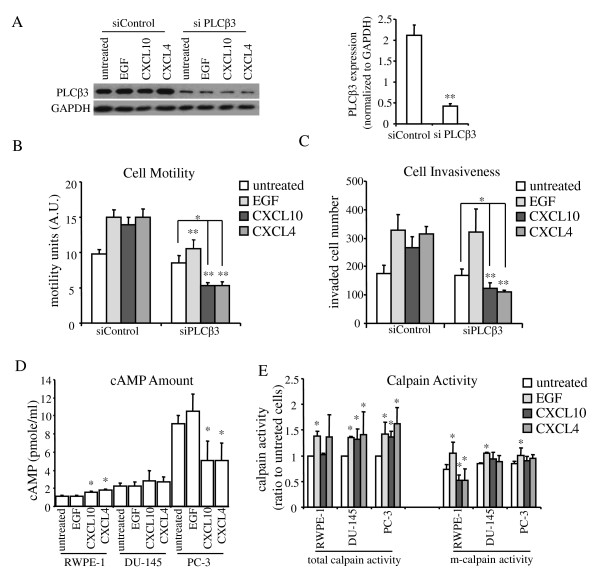
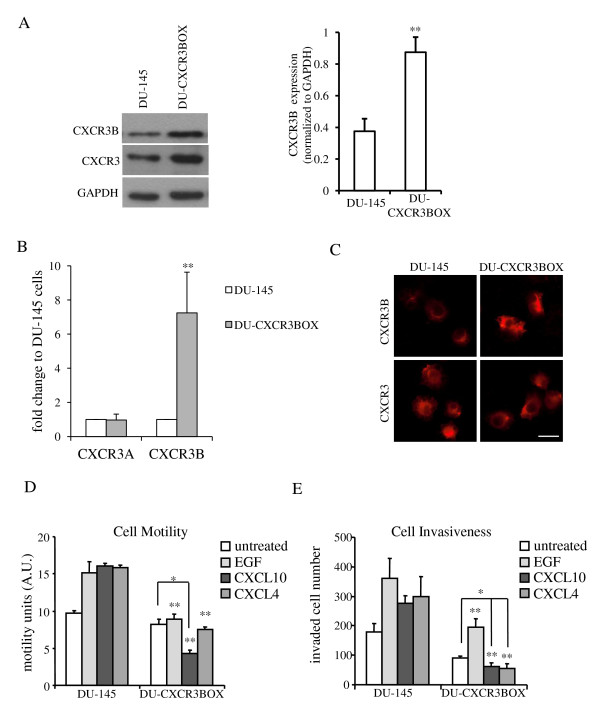
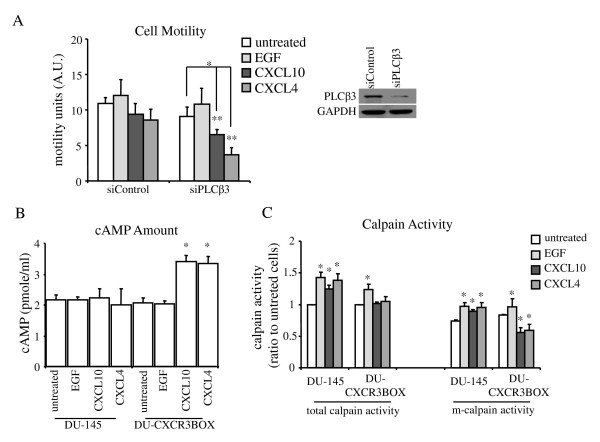
Results: Here, we examined the expression and function of two CXCR3 variants in human prostate cancer biopsies and cell lines. Globally, both CXCR3 mRNA and protein were elevated in localized and metastatic human cancer biopsies compared to normal. Additionally, CXCR3A mRNA level was upregulated while CXCR3B mRNA was downregulated in these prostate cancer specimens. In contrast to normal prostate epithelial cells (RWPE-1), CXCR3A was up to half the receptor in the invasive and metastatic DU-145 and PC-3 prostate cancer cells, but not in the localized LNCaP cells. Instead of inhibiting cell migration as in RWPE-1 cells, the CXCR3 ligands CXCL4/PF4 and CXCL10/IP10 promoted cell motility and invasiveness in both DU-145 and PC-3 cells via PLCβ3 and μ-calpain activation. CXCR3-mediated diminution of cell motility in RWPE-1 cells is likely a result of cAMP upregulation and m-calpain inhibition via CXCR3B signal transduction. Interestingly, overexpression of CXCR3B in DU-145 cells decreased cell movement and invasion.

Conclusion: These data suggest that the aberrant expression of CXCR3A and down-regulation of CXCR3B may switch a progression "stop" to a "go" signal to promote prostate tumor metastasis via stimulating cell migration and invasion.


Figures

Figure 1
Figure 1
CXCR3 expression and localization in prostate tumor tissues. (A) CXCR3 localization in human normal prostate, localized and metastatic prostate cancer. The insets are at higher magnification to show the cellular localization of CXCR3 in the boxed areas. Pictures are representative among the samples. Bar: 100 μm. (B) and (C) CXCR3 was upregulated in human localized and metastatic prostate cancer tissue. (B) Box plot of CXCR3 expression in human normal prostate, localized and metastatic prostate cancer by percentage of CXCR3-positive cells (*P < 0.01). (C) Quantification of CXCR3 expression in paired normal and cancerous prostate samples (P < 0.02).
Figure 2
Figure 2
mRNA expression of CXCR3 isoforms in prostate tumor tissues. (A) CXCR3, CXCR3A and CXCR3B mRNA expression in human normal prostate, localized and metastatic prostate cancer. The inserts are the high magnification pictures. Bar: 10 μm. (B) Quantification of CXCR3, CXCR3A andCXCR3B mRNA expression as shown in human normal prostate, localized and metastatic prostate cancer. Signal intensity was measured by imageJ and the signal intensities of normal tissues were set as 1 in each group.
Figure 3
Figure 3
CXCR3 expression in human normal and prostate cancer cell lines. (A) mRNA expression of CXCR3 in RWPE-1, DU-145, PC-3 and LNCaP cells. CXCR3 RNA was normalized to GAPDH RNA levels for that cell line, prior to normalizing to RWPE-1 cells. Histograms represent mean values (+/-s.d.) of more than three separate experiments. (B) mRNA expression of CXCR3A and CXCR3B in RWPE-1, DU-145, PC-3 and LNCaP cells. The concentration was calculated by a standard curve using known amounts of CXCR3A or CXCR3B plasmids. Histogram represent mean values (+/-s.d.) of more than three separate experiments (*P < 0.05 compared to RWPE-1). (C) Ratio of CXCR3A vs. CXCR3B mRNA expression. The calculation was based on the data in (B). DU-145 and PC-3 cells showed higher ratio than RWPE-1 cells. (D) Protein expression of total CXCR3 and CXCR3B in RWPE-1, DU-145, PC-3 and LNCaP cells. (E) Quantification of protein expression in prostate cancer cells. Histogram represent mean values (+/-s.d.) of three separate experiments (*P < 0.05 compared to RWPE-1).
Figure 4
Figure 4
CXCR3 chemokine promoted prostate cancer cell motility and cell invasion. (A) cell motility and (B) cell invasiveness in RWPE-1, DU-145 and PC-3 cells after 5 nM EGF or 1 μg/ml chemokine treatment for 16 hrs. The moving distance (arbitrary units, A.U.) in cell motility assay was measured by the pixel changes in ImageJ after 16 hrs. Cell invasiveness was evaluated by the number of invaded cells after 16 hr treatment in Matrigel invasion chamber system. Histogram represent mean values (+/-s.d.) of more than three separate experiments each in triplicate (*P < 0.05).
Figure 5
Figure 5
CXCR3 chemokine induced cell motility and invasion via PLCβ3 signaling pathway in prostate cancer cells and blocked cell motility by m-calpain activity inhibition in normal cells. (A) PLCβ3 was significantly knocked down in DU-145 cells by siRNA. Protein expression was quantified by ImageJ and normalized to GAPDH. Histogram represent mean values (+/-s.d.) of three separate experiments (**P < 0.05). CXCR3-chemokine-induced (B) cell motility and (C) cell invasiveness in DU-145 cells reduced after PLCβ3 downregulation. Histogram represent mean values (+/-s.d.) of three separate experiments (*P < 0.05, compared to untreated controls; **P < 0.05, compared to siControl group). (D) cAMP amount in RWPE-1, DU-145 and PC-3 cells after chemokine induction. Histogram represent mean values (+/-s.d.) of three separate experiments (*P < 0.05 compared to untreated controls). (E) Calpain activity in RWPE-1, DU-145 and PC-3 cells after chemokine treatment. Calpain activity was quantified by fluorescent intensity of calpain substrate. The signal intensities of untreated samples were set as 1 in each group. Histogram represents mean values (+/-s.d.) of three separate experiments (*P < 0.05 compared to untreated controls). Total calpain activity included both μ-calpain and m-calpain.
Figure 6
Figure 6
CXCR3B overexpression in DU-145 cells blocked chemokine-induced cell motility and invasion. (A) CXCR3 and CXCR3B protein expression in DU-145 and CXCR3B overexpression cells (**P < 0.05, compared to DU-145). The expression was quantified by ImageJ and normalized to GAPDH. (B) CXCR3A and CXCR3B mRNA expression in DU-145 and CXCR3B overexpression cells (**P < 0.05, compared to DU-145). This showed no CXCR3A mRNA upregulation in CXCR3B overexpression cells. (C) CXCR3B localization after CXCR3B plasmid expression in DU-145 cells. Bar: 20 μm. CXCR3-chemokine-induced (D) cell motility and (E) cell invasiveness in DU-145 cells decreased after CXCR3B expression. Same methods and analyses were used as in Figure 3. Histogram represent mean values (+/-s.d.) of three separate experiments (*P < 0.05, compared to untreated controls; **P < 0.05, compared to DU-145 group).
Figure 7
Figure 7
CXCR3B upregulation in DU-145 cells inhibited m-calpain activity. (A) Cell motility reduced in DU-145 CXCR3 overexpressing cells after PLCβ3 downregulation. Histogram represent mean values (+/-s.d.) of three separate experiments (*P < 0.05, compared to untreated controls; **P < 0.05, compared to siControl group). Western blot was representative for three separate experiments. (B) cAMP amount increased after chemokine treatment in DU-CXCR3BOX cells but not DU-145 cells. Histogram represent mean values (+/-s.d.) of three separate experiments (*P < 0.05 compared to untreated controls). (C) Calpain activity in DU-145 and DU-CXCR3BOX cells after chemokine treatment. Same methods and analyses were used as in Figure 4E. Histogram represent mean values (+/-s.d.) of three separate experiments (*P < 0.05 compared to untreated controls). Total calpain activity included both μ-calpain and m-calpain.

Similar articles

Cited by

References

    1. Jemal A, Siegel R, Ward E, Hao Y, Xu J, Thun MJ. Cancer statistics, 2009. CA Cancer J Clin. 2009;59:225–49. doi: 10.3322/caac.20006. - DOI - PubMed
    1. Vogiatzi P, Cassone M, Claudio L, Claudio PP. Targeted therapy for advanced prostate cancer: Looking through new lenses. Drug News Perspect. 2009;22:593–601. doi: 10.1358/dnp.2009.22.10.1443392. - DOI - PubMed
    1. Shepard DR, Raghavan D. Innovations in the systemic therapy of prostate cancer. Nat Rev Clin Oncol. 2010;7:13–21. doi: 10.1038/nrclinonc.2009.187. - DOI - PubMed
    1. Stavridi F, Karapanagiotou EM, Syrigos KN. Targeted therapeutic approaches for hormone-refractory prostate cancer. Cancer Treat Rev. 2010;36:122–30. doi: 10.1016/j.ctrv.2009.06.001. - DOI - PubMed
    1. Xie K, Huang S. Regulation of cancer metastasis by stress pathways. Clin Exp Metastasis. 2003;20:31–43. doi: 10.1023/A:1022590402748. - DOI - PubMed

Publication types