. 2012 Apr;107(7):2020-31.
doi: 10.1152/jn.00610.2011. Epub 2012 Jan 11.

Detecting event-related changes of multivariate phase coupling in dynamic brain networks

Affiliations

Detecting event-related changes of multivariate phase coupling in dynamic brain networks

Ryan T Canolty et al. J Neurophysiol. 2012 Apr.

Abstract

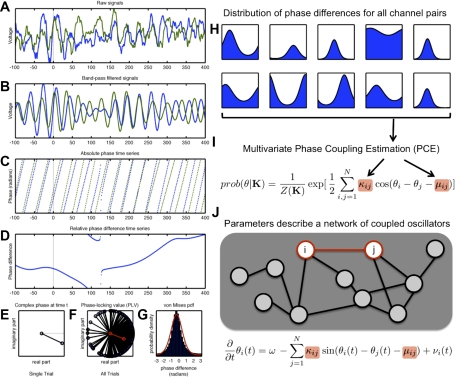
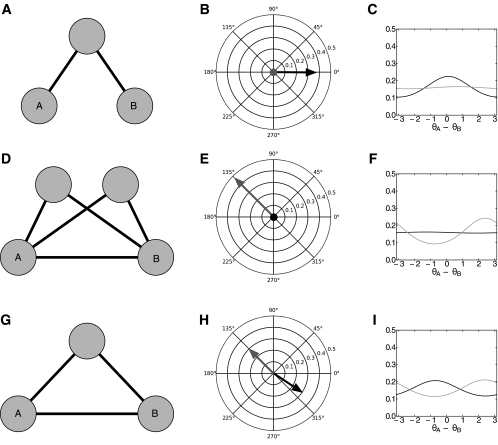
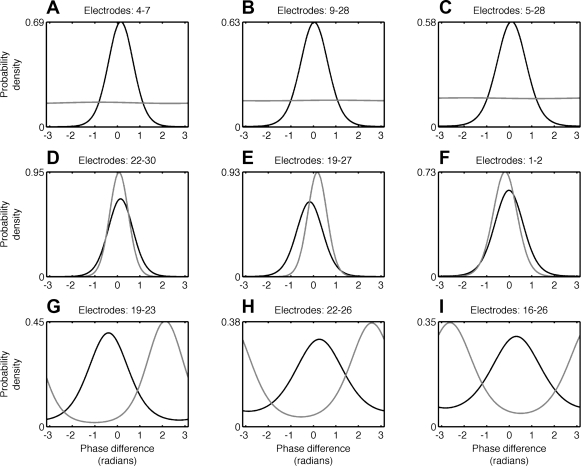
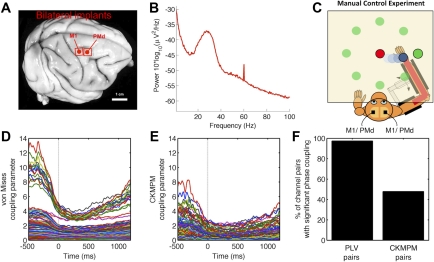
Oscillatory phase coupling within large-scale brain networks is a topic of increasing interest within systems, cognitive, and theoretical neuroscience. Evidence shows that brain rhythms play a role in controlling neuronal excitability and response modulation (Haider B, McCormick D. Neuron 62: 171-189, 2009) and regulate the efficacy of communication between cortical regions (Fries P. Trends Cogn Sci 9: 474-480, 2005) and distinct spatiotemporal scales (Canolty RT, Knight RT. Trends Cogn Sci 14: 506-515, 2010). In this view, anatomically connected brain areas form the scaffolding upon which neuronal oscillations rapidly create and dissolve transient functional networks (Lakatos P, Karmos G, Mehta A, Ulbert I, Schroeder C. Science 320: 110-113, 2008). Importantly, testing these hypotheses requires methods designed to accurately reflect dynamic changes in multivariate phase coupling within brain networks. Unfortunately, phase coupling between neurophysiological signals is commonly investigated using suboptimal techniques. Here we describe how a recently developed probabilistic model, phase coupling estimation (PCE; Cadieu C, Koepsell K Neural Comput 44: 3107-3126, 2010), can be used to investigate changes in multivariate phase coupling, and we detail the advantages of this model over the commonly employed phase-locking value (PLV; Lachaux JP, Rodriguez E, Martinerie J, Varela F. Human Brain Map 8: 194-208, 1999). We show that the N-dimensional PCE is a natural generalization of the inherently bivariate PLV. Using simulations, we show that PCE accurately captures both direct and indirect (network mediated) coupling between network elements in situations where PLV produces erroneous results. We present empirical results on recordings from humans and nonhuman primates and show that the PCE-estimated coupling values are different from those using the bivariate PLV. Critically on these empirical recordings, PCE output tends to be sparser than the PLVs, indicating fewer significant interactions and perhaps a more parsimonious description of the data. Finally, the physical interpretation of PCE parameters is straightforward: the PCE parameters correspond to interaction terms in a network of coupled oscillators. Forward modeling of a network of coupled oscillators with parameters estimated by PCE generates synthetic data with statistical characteristics identical to empirical signals. Given these advantages over the PLV, PCE is a useful tool for investigating multivariate phase coupling in distributed brain networks.


Figures

Fig. 1.
Fig. 1.
Schematic of computation of the phase-locking value (PLV), bivariate von Mises distribution, and the phase coupling estimation (PCE) methods. A: 2 local field potential (LFP) signals recorded from macaque primary motor cortex during a delayed center-out reach task. Shown is one 500 ms single-trial epoch. B: band-pass filtered LFP signals, filtered in the beta-band (at a center frequency of 32 Hz, corresponding to the peak in the power spectrum). C: instantaneous phase time series for the 2 filtered LFP signals. D: time series of the (real-valued) relative phase difference between the 2 filtered LFP signals. E: instantaneous phase difference at a single sample point (200 ms after movement onset) for the trial shown in A–D, represented in the complex plane (as a unit-length complex number). F: full set of instantaneous phase differences 200 ms after movement onset (black) across 250 independent trials. Length of the vector sum of these complex phases (red) corresponds to the PLV. G: alternatively, a probability density function (pdf) can be fit to this data; the von Mises distribution is the simplest (maximum entropy) distribution for data with a given mean phase and circular variance. H: steps A–G can be computed for all possible channel pairs, and these pair-wise statistics used to find parameter values (I) of the corresponding multivariate model. These parameters describe the maximum entropy distribution for N-dimensional phase vectors matching the observed pair-wise statistics. J: these parameters describe a dynamical system of coupled oscillators with symmetric coupling of strength κmn and phase offset μmn between nodes.
Fig. 2.
Fig. 2.
Direct multivariate phase coupling estimation correctly estimates phase coupling in networks where bivariate methods such as PLV or phase concentrations from von Mises distributions are misleading. Here we show 3 example networks (one in each row). A, D, and G: network coupling used to simulate a system of oscillators. B, E, and H: measured phase concentration (black vector) and estimated phase coupling (red vector) between oscillators A and B. Magnitude and angle of the phase concentration are plotted on the polar plot with angle equal to ΔAB and radius equal to γAB. Estimated phase coupling, κAB, and angle, μAB, are plotted similarly. C, F, and I: isolated distribution pisoA − θB κAB, μAB) (red line) and the empirical distribution pA − θB K) (black line) for the phase difference θA − θB. A–C: spurious coupling: phase concentration measurements (black vector and black line) indicate interaction between oscillators A and B when the true coupling and the estimated coupling (red vector and red line) have 0 magnitude. D–F: missing coupling: phase concentration indicates a lack of coupling between oscillators A and B, but the estimated phase coupling and true phase coupling indicate a strong interaction. G–I: incorrect phase offset: phase concentration indicates that oscillator A leads oscillator B; however, the true interaction and the estimated phase coupling indicate that oscillator A lags behind oscillator B.
Fig. 3.
Fig. 3.
Differences between bivariate and multivariate phase coupling in macaque LFP data. As in Fig. 2, C, F, and I, A–I show examples of spurious coupling, missing coupling, and incorrect phase offset, but in actual neurophysiological signals rather than simulated networks of coupled oscillations. A–C: examples of LFP electrode pairs that appear to be phase coupled when assessed using the bivariate PLV to identify empirical distributions (black), but show little or no coupling under PCE, from which we can determine the isolated distributions (red). Both the empirical and isolated distributions are von Mises distributions; see also Fig. 2, C, F, and I. In these cases, bivariate methods would infer direct coupling between the LFP channels while the multivariate PCE would not. D–F: in contrast, here bivariate methods (black) underestimate the direct coupling between channels compared with PCE. G–I: examples of cases where the bivariate von Mises approach and the multivariate PCE approach produce comparable estimates of coupling strength but differ on the relative phase offset between LFP channels.
Fig. 4.
Fig. 4.
Transient, event-related changes in beta-phase coupling in macaque motor network. A: photo indicating placement of multiple electrode arrays. For each 64 channel (8 × 8) microelectrode array, interelectrode spacing is 0.5 mm, such that full array covers 3.5 mm × 3.5 mm. Of the 192 implanted electrodes, 20 electrodes were selected for further analysis in this study [5 in contralateral primary motor cortex (M1), 10 in ipsilateral M1, and 5 in contralateral dorsal premotor cortex (PMd)]. B: power spectrum of LFP recorded from M1 which shows strong beta-band activity centered around 30 Hz. C: subject performed a delayed center out reach task to 1 of 8 targets during this study; see Ganguly et al. (2009) for details. D: estimates of the event-related changes in phase coupling assessed using bivariate statistics alone; the von Mises concentration parameter is inversely related to the circular variance, such that larger concentration parameters correspond to “peakier” distributions. Time (0 ms) is aligned to movement onset from the center. Note the strong drop in beta-phase coupling during movement. E: estimates of the event-related changes in phase coupling assessed using the multivariate PCE model. Note that PCE parameters are smaller in magnitude compared with von Mises parameters (D), with fewer channel pairs exhibiting strong phase coupling. F: bivariate and multivariate methods differ in their estimates of the number of channel pairs exhibiting significant periods of phase coupling, with PCE generating a sparser estimate of network activity and thus providing a more parsimonious interpretation of the data.
Fig. 5.
Fig. 5.
Stimulus-dependent changes in theta -phase coupling during a simple auditory target detection task (Canolty et al. 2007). A: theta (4–8 Hz)-phase coupling is stronger for targets compared with distracters and for verbs compared with nonwords (both P < 0.01). Values shown are the mean of the PCE parameters κi;j for all unique channel pairs considered. B: only pairs of electrodes with strong target-specific high gamma (80–150 Hz)-responses were examined (red); yellow lines indicate the subset of channel pairs with significant target-related changes in theta-phase coupling. PLV-based estimates (not shown) identify many more channel pairs. Three electrodes of interest are also marked: channels 57 (strong auditory responses), 16 (target-selective responses), and 62 (linguistic and motor responses). C: distribution of the phase differences between channels 16 and 62 during presentation of targets (red) or verbs (black) as estimated by the bivariate von Mises method (dashed lines) and the multivariate PCE (solid lines). Note that the bivariate approach produces similar estimates of phase coupling for both targets and verbs (dashed). In contrast, the PCE estimate of long-range theta-phase coupling is weak for verbs (black) but strong for targets (red), indicating that the direct coupling between these 2 channels increases during target detection and motor output. D: As in C, for channels 16 and 57. In this case, the strength of phase coupling detected by the PCE model is similar for targets and distracters, but there is a large phase shift between the 2 cases. In contrast, the bivariate approaches do not reflect this phase shift, most likely because such methods collapse all direct and indirect (network mediated) influences into 1 measure.

References

    1. Cadieu C, Koepsell K. Phase coupling estimation from multivariate phase statistics. Neural Comput 44: 3107–3126, 2010
    1. Canolty RT, Ganguly K, Ganguly K, Kennerley SW, Cadieu CF, Koepsell K, Wallis JD, Carmena JM. Oscillatory phase coupling coordinates anatomically-dispersed functional cell assemblies. Proc Natl Acad Sci USA 107: 17356–17361, 2010 - PMC - PubMed
    1. Canolty RT, Knight RT. The functional role of cross-frequency coupling. Trends Cogn Sci 14: 506–515, 2010 - PMC - PubMed
    1. Canolty RT, Soltani M, Dalal SS, Edwards E, Dronkers N, Nagara- jan S, Kirsch H, Barbaro N, Knight RT. Spatiotemporal dynamics of word processing in the human brain. Front Neurosci 1: 185–196, 2007 - PMC - PubMed
    1. Canolty RT, Cadieu CF, Koepsell K, Knight RT, Carmena JM. Multivariate phase-amplitude cross-frequency coupling in neurophysiological signals. IEEE Trans Biomed Eng 59: 8–11, 2012 - PMC - PubMed

Publication types

LinkOut - more resources