. 2012 Apr;107(7):2008-19.
doi: 10.1152/jn.00870.2011. Epub 2012 Jan 11.

Selective optogenetic stimulation of cholinergic axons in neocortex

Affiliations

Selective optogenetic stimulation of cholinergic axons in neocortex

Abigail Kalmbach et al. J Neurophysiol. 2012 Apr.

Abstract

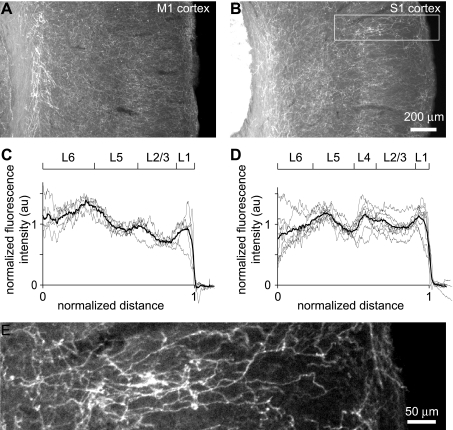
Acetylcholine profoundly affects neocortical function, being involved in arousal, attention, learning, memory, sensory and motor function, and plasticity. The majority of cholinergic afferents to neocortex are from neurons in nucleus basalis. Nucleus basalis also contains projecting neurons that release other transmitters, including GABA and possibly glutamate. Hence, electrical stimulation of nucleus basalis evokes the release of a mixture of neurotransmitters in neocortex, and this lack of selectivity has impeded research on cholinergic signaling in neocortex. We describe a method for the selective stimulation of cholinergic axons in neocortex. We used the Cre-lox system and a viral vector to express the light-activated protein channelrhodopsin-2 in cholinergic neurons in nucleus basalis and their axons in neocortex. Labeled neurons depolarized on illumination with blue light but were otherwise unchanged. In anesthetized mice, illumination of neocortex desynchronized the local field potential, indicating that light evoked release of ACh. This novel technique will enable many new studies of the cellular, network, and behavioral physiology of ACh in neocortex.


Figures

Fig. 1.
Fig. 1.
Expression of channelrhodopsin-2-yellow fluorescent protein fusion protein (ChR2-YFP) in nucleus basalis and neocortex. A: schematic illustration of the injection site in nucleus basalis, in coronal section, ∼0.3 mm posterior to bregma. The injection tract (dashed line) passes vertically through neocortex, caudate putamen (CP), and striatum en route to nucleus basalis (red). Our approach labeled cholinergic neurons in nucleus basalis and their axons that project to neocortex. LV, lateral ventricle. B: wide-field fluorescence images of a coronal section from an injected mouse, 4 wk after injection, with choline-acetyltransferase (ChAT) immunoreactivity and ChR2-YFP fluorescence in nucleus basalis. Globus pallidus (GP), caudate putamen (CP), neocortex (ctx), and nucleus basalis (NB) are labeled. Nucleus basalis, defined from anti-ChAT staining, is outlined on the ChAT image. The injection site, defined as the extent of somata labeled with ChR2-YFP, is outlined on the ChR2-YFP image. C: mean location and dimensions of the injection site from 5 mice. The density of anti-ChAT immunofluorescence was calculated as described in materials and methods. The relative intensities of staining along the major and minor axes of the injection site (dashed lines) are displayed in the inset. D: 2 images of ChR2-YFP-labeled neurons in nucleus basalis 3 wk after viral injection. Maximum intensity projections were derived from 2-photon z-stacks.
Fig. 2.
Fig. 2.
Time course of expression of ChR2-YFP. A: example of ChR2-YFP fluorescence in nucleus basalis and primary motor cortex 1, 2, and 3 wk after viral injection. Wide-field images are shown. B: quantification of ChR2-YFP fluorescence in nucleus basalis and primary motor cortex 0–6 wk after viral injection. For measurements from nucleus basalis, we measured the mean fluorescence in a region of interest placed over nucleus basalis; for measurements from neocortex, we manually counted axons labeled with ChR2-YFP (see Image Analysis in materials and methods). In both, data were normalized to those at 3 wk of age. Nucleus basalis measurements are from 25 mice, cortical measurements from 13 mice.
Fig. 3.
Fig. 3.
Laminar distribution of ChR2-YFP-labeled axons in neocortex. A and B: wide-field images of primary motor (A) and primary somatosensory (B) neocortex, showing many ChR2-YFP-labeled axons throughout all layers. C and D: laminar distribution of axon density, measured as fluorescence intensity, in primary somatosensory (C) and primary motor (D) neocortices. The approximate positions of laminar boundaries are indicated, based on the Allen Brain Atlas. Gray line: individual sections. Black lines: mean of 6 mice. au, Arbitrary units. E: axons are clearly visible in a higher-magnification image of a subregion (white rectangle) of B.
Fig. 4.
Fig. 4.
Selectivity of ChR2-YFP for cholinergic somata and axons. A: example of ChAT immunoreactivity and ChR2-YFP fluorescence in nucleus basalis. Maximum intensity projection was derived from a 2-photon z-stack. B: example of ChAT immunoreactivity and ChR2-YFP fluorescence in a coronal section of neocortex. A single 2-photon optical section is shown. For both A and B, images were acquired from a coronal section. The location of the images within the section is illustrated schematically above the images. AC, anterior commissure.
Fig. 5.
Fig. 5.
Astrocyte morphology is unchanged by ChR2-YFP expression. A: example of glial fibrillary acidic protein (GFAP) immunohistochemistry. Middle: wide-field image of a coronal section. The extent of ChR2-YFP labeling is outlined. Peripheral images: 2-photon maximum intensity projections from ipsi- and contralateral nucleus basalis and neocortex. B: intensity of anti-GFAP immunofluorescence as a function of time after viral injection, expressed as a ratio in intensity in ipsi- and contralateral hemispheres. The ratio of ∼1 indicates that there was no increase in anti-GFAP immunofluorescence near the injection site. Points are the means ± SE from 3, 4, 4, and 1 mice at 1, 2, 3, and 4 wk, respectively.
Fig. 6.
Fig. 6.
Health of neurons in nucleus basalis expressing ChR2-YFP. A: images of an infected neuron in an acute slice from nucleus basalis. The infected neuron expresses ChR2-YFP (green) and was filled with Alexa Fluor 594 (red) via a whole cell recording. Images are maximum intensity projections acquired by 2-photon microscopy using excitation wavelengths of 840 nm (Alexa Fluor 594 image) and 910 nm (ChR2-YFP image). B: example voltage recordings from a neuron in nucleus basalis labeled with ChR2-YFP. Note the pronounced slow afterhyperpolarization (arrowheads), which is characteristic of cholinergic neurons in nucleus basalis (Hedrick and Waters 2010). Current injections were 25 pA for 300 ms and 900 pA for 1 ms. C: mean ± SE spiking frequency of 9 infected neurons as a function of current injected via the somatic recording pipette.
Fig. 7.
Fig. 7.
Blue light depolarizes infected neurons in nucleus basalis. A: output of a blue light-emitting diode (LED) in response to 2-ms commands of 1, 3, and 5 V. Output was measured with a photomultiplier tube. Intensity at the focal plane (y-axis) was calculated for a ×40/0.8-numerical aperture (NA) objective after measuring the intensity of illumination through the objective using a handheld light meter. B: example voltage recordings from the neuron shown in Fig. 6, showing responses to blue light illumination of 300 and 5 ms. The timing of blue light illumination is indicated below each voltage trace. Illumination intensity was 6.5 mW/mm2. C: voltage responses of an infected neuron to trains of 5-ms blue light stimuli at different frequencies. Illumination intensity was 6.5 mW/mm2. D: spiking probability as a function of stimulus frequency during trains of 5-ms blue light stimuli. Points are for the neuron in E. The line and shaded area are the mean relationship and 95% confidence interval, respectively, for 5 neurons. Illumination intensity was 6.5 mW/mm2.
Fig. 8.
Fig. 8.
Optogenetic desynchronization of the neocortical local field potential. A–C: examples of desynchronization of the local field potential measured in primary motor cortex, evoked by a brief (∼2-s) manual pinch of the animal's tail (A), by electrical stimulation of nucleus basalis (B), and by illumination of the neocortical surface with blue (473-nm) light (C; 10-ms pulses at 20 Hz). Each example is from a different mouse. D: power-spectral densities during 3 5-s sections of the local field recording illustrated in C, starting 10, 5, and 0 s before onset of blue light illumination. The 3 sections are color-coded and numbered (inset), with red representing the 1st section from 10 to 5 s before illumination (section 1), green representing the 2nd section from 5 to 0 s before illumination (section 2), and illumination beginning at the start of the blue section (section 3). Power in the 0.4- to 1-Hz band (shaded area) was used to monitor desynchronization. E–G: traces in A–C band-pass filtered at 0.4–1 Hz. H–J: mean (±SE) changes in power-spectral density at 0.4–1 Hz for tail pinch, electrical stimulation of nucleus basalis, and 473-nm illumination of neocortex, respectively. Each bar represents the power in a 5-s long section of the trace, with the stimulus beginning at the start of the 3rd section. In each trial, the power was normalized to the average of the 10-s long prestimulus period. Tail pinch: manual tail pinch for 2 s, n = 8 mice. Electrical stimulation: 50 pulses at 100 Hz, n = 5 mice. 473-nm Illumination: 50- × 10-ms pulses at 20 Hz, n = 9 mice. K: effect of blue light on 0.4- to 1-Hz power, expressed as a ratio of power after and before illumination (power in section 3 ÷ power in section 1). In this animal, neocortex was illuminated 19 times over ∼1 h, and the power ratio is plotted for each trial. As an internal control, the power ratio during sections 1 and 2 is also plotted for each trial. L: frequency histogram of power ratios for the animal in E, with each trial counted once. Power ratio was reduced in response to illumination with 473-nm light. M: frequency histogram summarizing results from 25 mice. In each mouse, desynchronization was monitored in multiple trials, yielding a median power ratio for the effect of blue light (ratio 3:1) and for the prestimulus period (ratio 2:1) for each mouse.
Fig. 9.
Fig. 9.
Blue light fails to evoke desynchronization in ACh receptor antagonists. A: example trace under control conditions, showing desynchronization is response to blue (473-nm) light (50 10-ms pulses at 20 Hz). B: power-spectral densities during 3 5-s sections of the local field recording illustrated in A, starting 10, 5, and 0 s before onset of blue light illumination. The 3 sections are color-coded and numbered (inset), with red representing the 1st section from 10 to 5 s before illumination (section 1), green representing the 2nd section from 5 to 0 s before illumination (section 2), and illumination beginning at the start of the blue section (section 3). Power in the 0.4- to 1-Hz band (shaded area) was used to monitor desynchronization. C and D: example trace and corresponding power-spectral densities after application of cholinergic receptor antagonists to the brain surface. E: mean ± SE desynchronization (3:1 ratio, 0.4- to 1-Hz band) before and after addition of 100 μM atropine and 3 mM mecamylamine to the brain surface in the experiment illustrated in A–D; n = 20 and 25 trials under control conditions (ctrl) and in cholinergic receptor antagonists (+ ant.), respectively. F: pooled results showing the mean (±SE) of 3:1 ratio before and after addition of cholinergic receptor antagonists in 9 mice.

Similar articles

Cited by

References

    1. Aravanis AM, Wang LP, Zhang F, Meltzer LA, Mogri MZ, Schneider MB, Deisseroth K. An optical neural interface: in vivo control of rodent motor cortex with integrated fiberoptic and optogenetic technology. J Neural Eng 4: S143–S156, 2007 - PubMed
    1. Avendanǒ C, Umbriaco D, Dykes RW, Descarries L. Acetylcholine innervation of sensory and motor neocortical areas in adult cat: a choline acetyltransferase immunohistochemical study. J Chem Neuroanat 11: 113–130, 1996 - PubMed
    1. Ayling OG, Harrison TC, Boyd JD, Goroshkov A, Murphy TH. Automated light-based mapping of motor cortex by photoactivation of channelrhodopsin-2 transgenic mice. Nat Methods 6: 219–224, 2009 - PubMed
    1. Bell KA, Shim H, Chen CK, McQuiston AR. Nicotinic excitatory postsynaptic potentials in hippocampal CA1 interneurons are predominantly mediated by nicotinic receptors that contain α4 and β2 subunits. Neuropharmacology 61: 1379–1388, 2011 - PMC - PubMed
    1. Berg RW, Friedman B, Schroeder LF, Kleinfeld D. Activation of nucleus basalis facilitates cortical control of a brain stem motor program. J Neurophysiol 94: 699–711, 2005 - PubMed

Publication types

MeSH terms

Substances

LinkOut - more resources