. 2012 Jan 11:6:3.
doi: 10.1186/1752-0509-6-3.

Biomarker robustness reveals the PDGF network as driving disease outcome in ovarian cancer patients in multiple studies

Affiliations

Biomarker robustness reveals the PDGF network as driving disease outcome in ovarian cancer patients in multiple studies

Rotem Ben-Hamo et al. BMC Syst Biol. .

Abstract

Background: Ovarian cancer causes more deaths than any other gynecological cancer. Identifying the molecular mechanisms that drive disease progress in ovarian cancer is a critical step in providing therapeutics, improving diagnostics, and affiliating clinical behavior with disease etiology. Identification of molecular interactions that stratify prognosis is key in facilitating a clinical-molecular perspective.

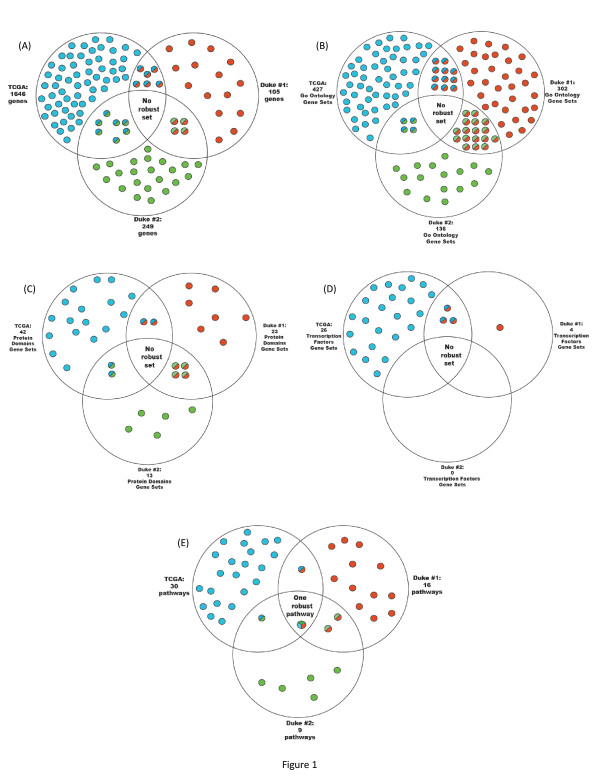
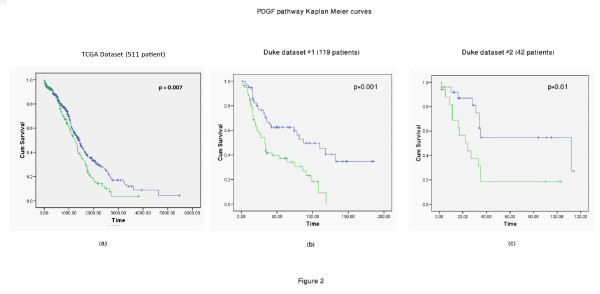
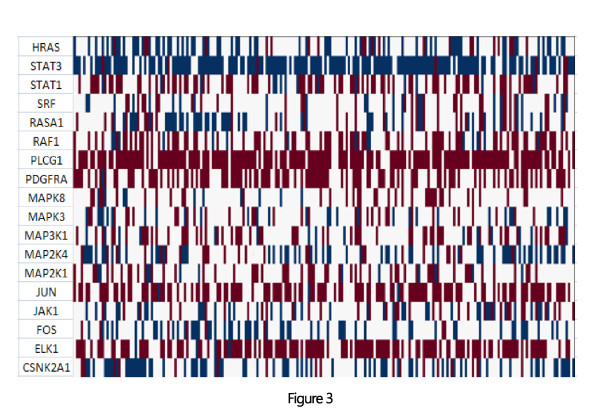
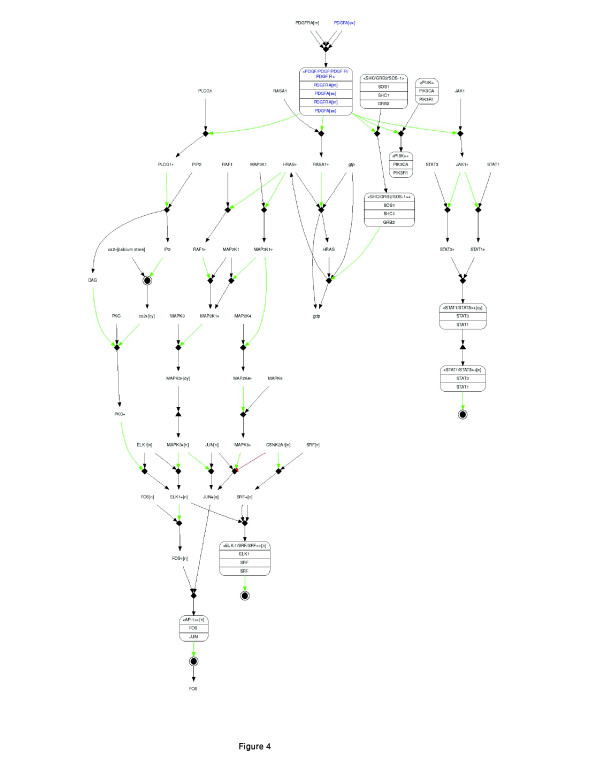
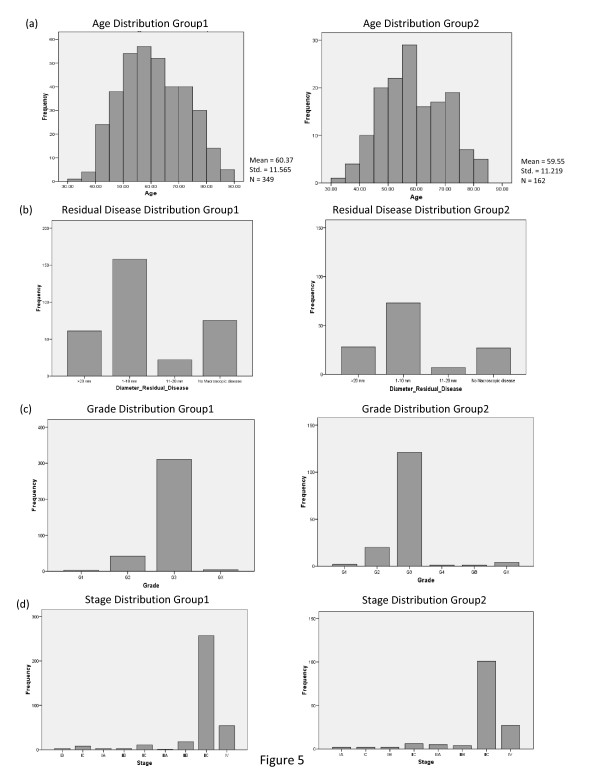
Results: The Cancer Genome Atlas has recently made available the molecular characteristics of more than 500 patients. We used the TCGA multi-analysis study, and two additional datasets and a set of computational algorithms that we developed. The computational algorithms are based on methods that identify network alterations and quantify network behavior through gene expression.We identify a network biomarker that significantly stratifies survival rates in ovarian cancer patients. Interestingly, expression levels of single or sets of genes do not explain the prognostic stratification. The discovered biomarker is composed of the network around the PDGF pathway. The biomarker enables prognosis stratification.

Conclusion: The work presented here demonstrates, through the power of gene-expression networks, the criticality of the PDGF network in driving disease course. In uncovering the specific interactions within the network, that drive the phenotype, we catalyze targeted treatment, facilitate prognosis and offer a novel perspective into hidden disease heterogeneity.


Figures

Figure 1
Figure 1
Venn diagrams demonstrate the overlap/lack of overlap between prognostic biomarkers. (a) Blue circles stand for the genes identified as significant in stratifying patients into survival groups in TCGA. Red circles are genes identified in Duke set #1 and green circles are genes identified in Duke set #2. The shared colored circles are genes shared between datasets. While some genes are shared between two groups, none is shared among all three datasets. (b-d) Venn diagrams for the gene set signature analysis. In contrast, (e) shows the same analyses performed via pathway metrics. One pathway (PDGF signaling pathway) is shared among the three datasets and demonstrates the robustness of the pathway approach.
Figure 2
Figure 2
Kaplan-Meier curves generated according to values of the PDGF pathway. Panel (a) shows the KM curve generated using the TCGA dataset. Panels (b) and (c) show curves from Duke Dataset #1 and #2 respectively. Across the three panels, Group1 (blue line), which is affiliated with better prognosis, shows lower pathway activity values and Group2 (green line) shows higher pathway activity values. The affiliation of pathway metric levels with prognosis is highly robust in this case, as it shows low p-values and consistent behavior across datasets.
Figure 3
Figure 3
CNV HeatMap of alteration in gene members of the PDGF signaling pathway across 511 patients from the TCGA database. Blue indicates amplification and red deletion. A closer examination of the figure demonstrates that for each patient a different non-empty set of genes is being targeted by genomic alterations, but the pathway is targeted in one form or another across the set.
Figure 4
Figure 4
The PDGF pathway diagram taken from NCI's Pathway-Interaction-Database (PID). Pathway members and the interactions between them are used as the basis for the computational metric of pathway behavior. Interactions are quantified according to gene-expression abundance and are iterated across the pathway.
Figure 5
Figure 5
Distribution of clinical features in the two groups stratified by the PDGF metrics: (A) Age, (B) Diameter of residual disease, (C) Stage, (D) and Grade distribution between the two groups. The figure demonstrates that the two groups display very similar clinical features.

Similar articles

Cited by

References

    1. The-Cancer-Genome-Atlas-Research-Network. Comprehensive genomic characterization defines human glioblastoma genes and core pathways. Nature. 2008;455(7216):1061–1068. - PMC - PubMed
    1. Jemal A, Siegel R, Ward E, Hao Y, Xu J, Thun MJ. Cancer statistics, 2009. CA Cancer J Clin. 2009;59(4):225–249. - PubMed
    1. Ahluwalia A, Yan P, Hurteau JA, Bigsby RM, Jung SH, Huang TH, Nephew KP. DNA methylation and ovarian cancer. I. Analysis of CpG island hypermethylation in human ovarian cancer using differential methylation hybridization. Gynecol Oncol. 2001;82(2):261–268. - PubMed
    1. Bardos A. Treatment of ovarian cancer. 2004.
    1. Swanton C, Caldas C. Molecular classification of solid tumours: towards pathway-driven therapeutics. Br J Cancer. 2009;100(10):1517–1522. - PMC - PubMed

Publication types