. 2012 Apr 1;318(6):768-78.
doi: 10.1016/j.yexcr.2011.12.017. Epub 2011 Dec 29.

Up-regulation of 12(S)-lipoxygenase induces a migratory phenotype in colorectal cancer cells

Affiliations

Up-regulation of 12(S)-lipoxygenase induces a migratory phenotype in colorectal cancer cells

T Klampfl et al. Exp Cell Res. .

Abstract

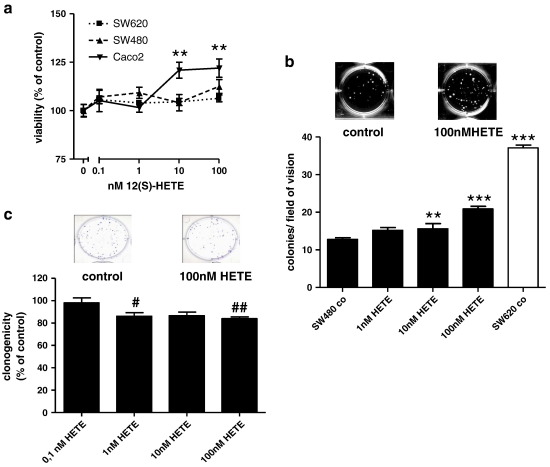
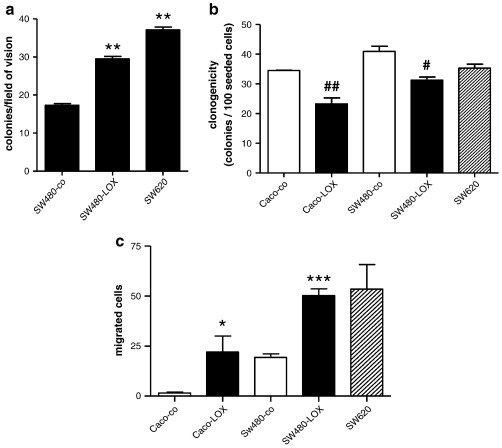
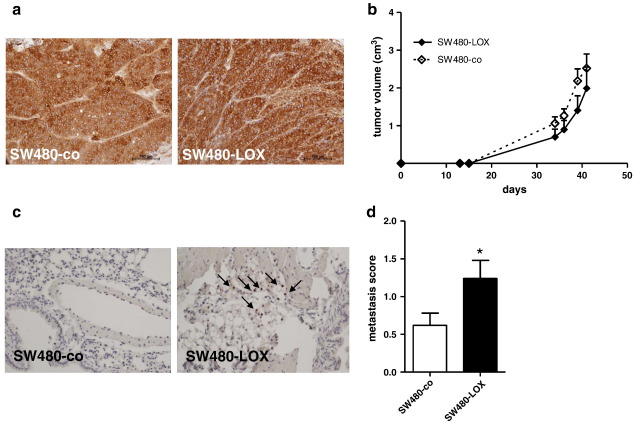
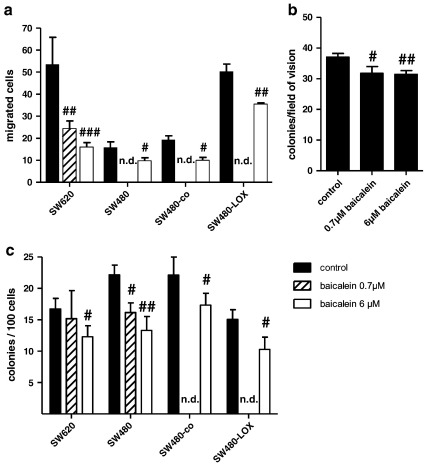
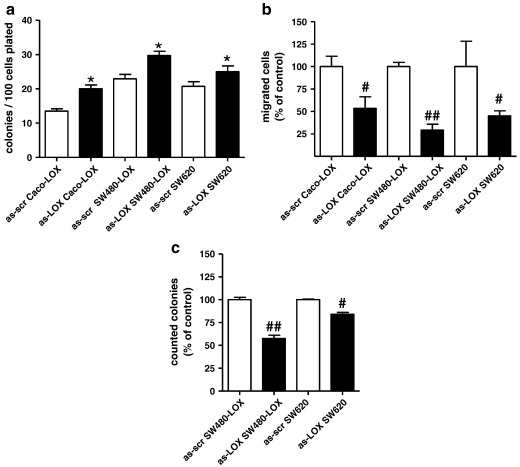
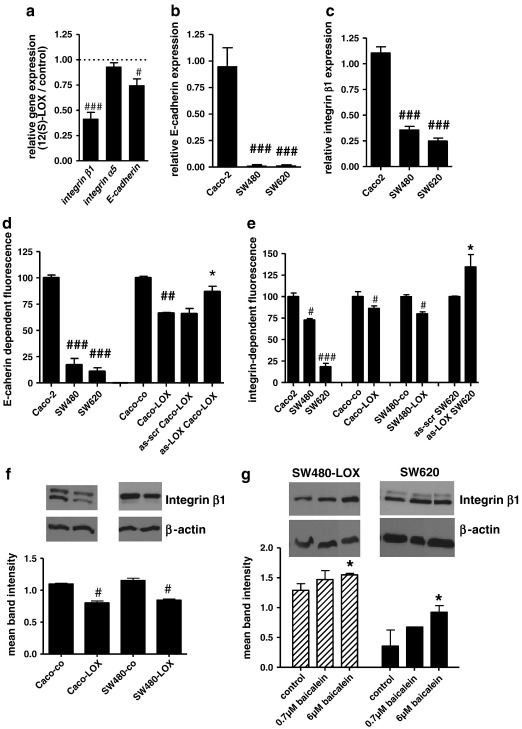
12(S)-Lipoxygenase (LOX) and its product 12(S)-hydroxyeicosatetraenic (HETE) acid have been implicated in angiogenesis and tumour invasion in several tumour types while their role in colorectal cancer progression has not yet been studied. We have analysed 12(S)-LOX expression in colorectal tumours and found gene expression up-regulated in colorectal cancer specimens for which the pathology report described involvement of inflammation. Using cell line models exposed to 12(S)-HETE or over-expressing 12(S)-LOX malignant cell growth as well as tumour cell migration was found to be stimulated. Specifically, Caco2 and SW480 cells over-expressing 12(S)-LOX formed fewer colonies from sparse cultures, but migrated better in filter-migration assays. SW480 LOX cells also had higher anchorage-independent growth capacity and a higher tendency to metastasise in vivo. Knock-down or inhibition of 12(S)-LOX inhibited cell migration and anchorage-independent growth in both 12(S)-LOX transfectants and SW620 cells that express high endogenous levels of 12(S)-LOX. On the cell surface E-cadherin and integrin-β1 expression were down-regulated in a 12(S)-LOX-dependent manner disturbing cell-cell interactions. The results demonstrate that 12(S)-LOX expression in inflammatory areas of colorectal tumours has the capacity to induce an invasive phenotype in colorectal cancer cells and could be targeted for therapy.


Figures

Fig. 1
Fig. 1
Effects of 12(S)-HETE on cell number a: Cells were plated in 24-well plates at 5 × 104 cells/well and left to attach for 24 h before exposure to 12(S)-HETE. The number of viable cells was determined by neutral red uptake and calculated relative to controls. ** represents an increase as compared to the respective controls at p < 0.01. b: 5000 SW480 or SW620 cells were suspended in agar medium containing appropriate 12(S)-HETE concentrations to determine anchorage-independent growth. SW620 cells were used as a positive control for agar growth. After 3 weeks colonies were scored at 4-fold magnification in 2 independent experiments using triplicate cultures. All data points represent the mean ± SD, the overall induction was significant at p < 0.001 by one-way ANOVA, for single column comparison ** and *** indicate an increase above control at p < 0.01 and p < 0.001 respectively. c: 100 SW480 cells/well were seeded into 6-well plates using medium supplemented with 12(S)-HETE at the concentrations indicated and left to attach overnight. The medium together with any cells that had not attached was removed. After the medium change cultures were maintained in standard growth medium for 1 week. Colonies were fixed, stained with crystal violet and counted. All data points represent the mean ± SD of 2 independent experiments, the overall decrease was significant at p < 0.05 by one-way ANOVA and for single column comparisons # and ## indicate a decrease as compared with control at p < 0.05 or 0.01 respectively.
Fig. 2
Fig. 2
Biological impact of 12(S)-LOX expression. a: 5000 cells each of SW480-co and SW480-LOX were suspended in agar medium to determine anchorage-independent growth and colonies were scored after 3 weeks. SW620 cells were used as a positive control. The results represent means ± SD of at least 3 independent experiments using triplicate cultures. ** indicates an increase above SW480-co at p < 0.01 by unpaired t-test. b: Cells were plated at 100 (SW480-co, SW480-LOX) or 200 (Caco-co, Caco-LOX, SW620) cells/well in 6-well plates for assessment of clonogenicity. Medium was changed and un-attached cells removed after 24 h. Colonies were counted after 7 days in culture. Results were calculated per 100 cells and presented as mean ± SD of at least 3 independent experiments with # and ## representing a decrease as compared to the respective control at p < 0.05 and 0.01 respectively by unpaired t-test. c: Cell migration was determined by filter migration assay. After a migration period of 24 h (SW480 transfectants, SW620) or 48 h (Caco2 transfectants) cells on the bottom of the membrane (Caco2 transfectants) or in the lower chamber (SW480 transfectants and SW620) were fixed, stained with crystal violet and counted. The results represent the mean ± SD of 3 independent experiments using duplicate cultures. * and *** indicate an increase above control at p < 0.05 and p < 0.001 respectively by unpaired t-test.
Fig. 3
Fig. 3
12(S)-LOX induced tumour growth and metastasis. 106 cells each of SW480-co and SW480-LOX cells were injected s.c. into SCID-mice. Tumour growth was monitored regularly and the mice sacrificed when tumour size reached 5 cm3 or after 9 weeks whichever came first. The tumours were fixed in 4% formalin and analysed by immunohistochemistry using antibodies directed against cytokeratin 20 (a). Tumour growth did not differ between the SW480-LOX and SW480-co group (b). Lungs were isolated from the tumour-bearing mice bearing SW480 tumours and fixed with formalin. Serial sections were stained using antibodies recognising Ki67 to detect tumour cells (arrows in c). Ki67-positive tumour cells in the lungs were scored according to the criteria given in materials and methods (d). * indicates a significant increase as compared to control at p = 0.0281 by Mann–Withney test.
Fig. 4
Fig. 4
Biological impact of 12(S)-LOX inhibition by baicalein. a: Cell migration was determined as described in Fig. 2 but in the presence of baicalein at 0.7 μM (hatched bars) or 6 μM (open bars). SW620 and SW480 groups were obtained from untransfected cultures and SW480-LOX and SW480-co groups represent LOX transfectants and vector controls. The results represent means ± SD of 3 independent experiments using duplicate cultures. #, ## and ### indicate a decrease as compared to control at p < 0.05, p < 0.01 and p < 0.001 respectively. n.d = not determined. b: 5000 SW620 cells were suspended in soft agar medium containing baicalein at the indicated concentrations. Number of colonies was scored microscopically after 2 weeks of growth. The results shown represent the pooled data from 3 experiments using triplicate cultures and #, ## indicate a decrease as compared to control at p < 0.05 and p < 0.01 respectively. c: Clonogenicity was determined as described in Fig. 2. Baicalein was present during the attachment period, but not during the growth period. The results represent means ± SD of 3 independent experiments using triplicate cultures. n.d = not determined; # and ## indicate a decrease as compared to control at p < 0.05 and p < 0.001 respectively.
Fig. 5
Fig. 5
Knock-down of 12(S)-LOX expression. Anti-sense oligonucleotides were introduced into the cells by lipofection according to the transfection scheme described in supplemental materials. This achieved a ≥ 50% reduction of 12(S)-LOX expression and 12(S)-HETE production (supplemental materials Figure 4s). At the time point when expression was at the minimum cells were (a) plated for clonogenicity assays, (b) placed into filter inserts for migration assays and (c) suspended in soft agar medium to determine anchorage-independent growth. All data points represent the mean ± SEM of at least 2 independent experiments using triplicate cultures. * indicates increased above control at p < 0.05; #, and ## a decrease as compared to control at p < 0.05 and 0.01 respectively.
Fig. 6
Fig. 6
Differential expression of cell surface molecules. a: RNA was isolated from Caco2-LOX and Caco2-co cultures and expression of E-cadherin, integrin α5 and integrin β1 determined by qRT-PCR. # and ## represent a decrease as compared to control at p < 0.05 and 0.01 by Mann–Withney test. b, c: RNA was isolated for the determination of E-cadherin (b) and integrin β1 (c) expression by qRT-PCR. Results are shown relative to GAPDH expression. ### indicates a decrease as compared to Caco2 at p < 0.001 by unpaired t-test. d, e: Untransfected cultures (Caco2, SW480, SW620) and Caco2 transfectants (Caco-co, Caco-LOX) were harvested at semi-confluence. In Caco-LOX cells 12(S)-LOX expression was knocked down by lipofection with an anti-sense oligonucleotide (as-scr Caco-LOX and as-LOX Caco-LOX) and cultures were used at the time-point of minimal 12(S)-LOX expression. E-cadherin (d) and integrin β1 (e) on the cell surface was determined by FACS analysis. The mean fluorescence intensity was used as a measure of protein expression. The data were normalised to Caco2 or the respective control for better comparison. All data represent pooled results from 3 independent experiments using duplicate measurements. #, ##, ### indicate a decrease as compared to the respective controls at p < 0.05; 0.01 or 0.001. * represents an increase at p < 0.05 by Mann–Withney test. f: Cultures were grown to semi-confluence and then homogenised in lysis buffer for determination of integrin β1 by western blotting. The figure depicts representative blots above the column of semi-quantitative assessment of band intensity. Results are pooled from at least 2 experiments using duplicate lanes and # indicates a decrease at p < 0.05. g: SW620 and SW480-LOX cells were grown to semi-confluence and then exposed to 0.7 μM or 6 μM baicalein in serum-free medium. Protein was harvested and integrin β1 level determined as described above. All data points represent the mean ± SEM of 2 independent experiments using duplicate cultures. * increased above control at p < 0.05.

References

    1. Silverman E.S., Drazen J.M. The biology of 5-lipoxygenase: function, structure, and regulatory mechanisms. Proc. Assoc. Am. Physicians. 1999;111:525–536. - PubMed
    1. Funk C.D., Chen X.S., Johnson E.N., Zhao L. Lipoxygenase genes and their targeted disruption. Prostaglandins Other Lipid Mediat. 2002;68–69:303–312. - PubMed
    1. Kühn H., O'Donnell V.B. Inflammation and immune regulation by 12/15-lipoxygenases. Prog. Lipid Res. 2006;45:334–356. - PubMed
    1. Kuhn H. Biologic relevance of lipoxygenase isoforms in atherogenesis. Expert Rev. Cardiovasc. Ther. 2005;3:1099–1110. - PubMed
    1. Kuhn H., Walther M., Kuban R.J. Mammalian arachidonate 15-lipoxygenases structure, function, and biological implications. Prostaglandins Other Lipid Mediat. 2002;68–69:263–290. - PubMed

Publication types

MeSH terms

Substances