. 2012 May 1;302(9):C1331-45.
doi: 10.1152/ajpcell.00207.2011. Epub 2012 Jan 11.

Resolvin D1 prevents TNF-α-mediated disruption of salivary epithelial formation

Affiliations

Resolvin D1 prevents TNF-α-mediated disruption of salivary epithelial formation

Olutayo Odusanwo et al. Am J Physiol Cell Physiol. .

Abstract

Sjögren's syndrome is a chronic autoimmune disorder characterized by inflammation of salivary glands resulting in impaired secretory function. Our present studies indicate that chronic exposure of salivary epithelium to TNF-α and/or IFN-γ alters tight junction integrity, leading to secretory dysfunction. Resolvins of the D-series (RvDs) are endogenous lipid mediators derived from DHA that regulate excessive inflammatory responses leading to resolution and tissue homeostasis. In this study, we addressed the hypothesis that activation of the RvD1 receptor ALX/FPR2 in salivary epithelium prevents and/or resolves the TNF-α-mediated disruption of acinar organization and enhances monolayer formation. Our results indicate that 1) the RvD1 receptor ALX/FPR2 is present in fresh, isolated cells from mouse salivary glands and in cell lines of salivary origin; and 2) the agonist RvD1 (100 ng/ml) abolished tight junction and cytoskeletal disruption caused by TNF-α and enhanced cell migration and polarity in salivary epithelium. These effects were blocked by the ALX/FPR2 antagonist butyloxycarbonyl-Phe-Leu-Phe-Leu-Phe. The ALX/FPR2 receptor signals via modulation of the phosphatidylinositol 3-kinase (PI3K)/Akt signaling pathways since, in our study, blocking PI3K activation with LY294002, a potent and selective PI3K inhibitor, prevented RvD1-induced cell migration. Furthermore, Akt gene silencing with the corresponding siRNA almost completely blocked the ability of Par-C10 cells to migrate. Our findings suggest that RvD1 receptor activation promotes resolution of inflammation and tissue repair in salivary epithelium, which may have relevance in the restoration of salivary gland dysfunction associated with Sjögren's syndrome.


Figures
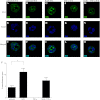
Fig. 1.
Fig. 1.
Resolvin D1 (RvD1) treatment enhances acinar formation in Par-C10 cells grown on growth-factor-reduced (GFR)-Matrigel. Par-C10 cells grown on GFR-Matrigel in 8-well chambers as described in materials and methodsand incubated in the absence (A–C, 24 h and D–F, 60 h) or presence of RvD1 (100 ng/ ml; G–I, 60 h), TNF-α (100 ng/ml; J–L, 60 h), or RvD1 and TNF-α (100 ng/ml; M–O, 60 h) added at plating. Acinar spheres were subjected to immunofluorescence by using goat anti-rabbit anti-ZO-1 (A, D, G, J, and M; green) followed by Hoechst nuclear stain (B, E, H, K, and N; blue). The xy cross section images were obtained and analyzed using a Carl Zeiss 510 confocal microscope. Lumen sizes were quantified and expressed as means ± SE of results from 3 or more experiments (P), where *P <0.05 indicates significant differences from control cells.
Fig. 2.
Fig. 2.
RvD1 treatment enhances monolayer formation in Par-C10 cells grown on permeable supports. Par-C10 cells were cultured on permeable supports, as described in materials and methodsand incubated in the absence (A–F) or presence of RvD1 (100 ng/ ml; G–L), TNF-α (100 ng/ml; M–R), or RvD1 and TNF-α (100 ng/ml; S–X) added at plating for 24 h and 60 h. Monolayers were subjected to immunofluorescence using goat anti-rabbit anti-ZO-1 (C, I, O, and U; green) followed by phalloidin staining (D, J, P, and V; red) and Hoechst nuclear stain (E, K, Q, and W; blue). The xy cross sections images were obtained and analyzed using a Zeiss AxioImager fluorescence microscope. ZO-1 fluorescence intensity of defined tight junction (TJ) areas was quantified using ImageJ NIH software and expressed as means ± SE of results from 3 or more experiments (Fig. 2Y), where *P or **P < 0.05 indicates significant differences from control cells. ZO-1 expression was detected by Western blot analysis as described in materials and methods (Z). Data represent the means ± SE of results from 3 experiments (Z1), where *P < 0.05 indicates significant differences from untreated and RvD1-treated cells. Arrowheads indicate ZO-1 expression. Arrows indicate actin stress fibers.
Fig. 3.
Fig. 3.
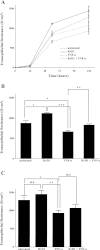
RvD1 increases transepithelial resistance (TER) in untreated and TNF-α-treated Par-C10 cell monolayers. A: Par-C10 cells were cultured on permeable supports as described in materials and methodsand exposed to TNF-α (100 ng/ml) and/or RvD1 (100 ng/ml) at plating. TER was measured at different times during monolayer formation until confluence was reached. Following subtraction of medium resistance (120 Ω), tissue resistance was multiplied by the effective membrane area (1.13 cm2) and expressed as means ± SE of results from 3 or more experiments. B: results at 60 h are shown in a bar graph, where *P < 0.05 indicates significant differences from untreated cells, **P < 0.05 indicates significant differences between TNF-α and TNF-α + RvD1-treated cells, and ***P < 0.05 indicates significant differences between TNF-α and RvD1-treated cells. C: results at 5 days are shown in a bar graph, where *P < 0.05 indicates significant differences from untreated cells, **P < 0.05 indicates significant differences between TNF-α and RvD1-treated cells, and n.s. indicates nonsignificant differences.
Fig. 4.
Fig. 4.
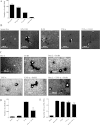
RvD1 promotes organized cell migration in Par-C10 cells. A: chemotaxis of Par-C10 cells. Cells (5×10⁴) were seeded into the upper chamber of transwells. Lower chambers contained serum-free medium with or without RvD1 (10–100 ng/ml). Cell migration was evaluated 24 h after RvD1 stimulation and is expressed as the number of cells that moved across the transwell membranes in response to RvD1 compared with untreated controls. B: chemokinetic movement of Par-C10 cells. Cells were plated on a lawn of microscopic fluorescent beads, treated with TNF-α (100 ng/ml) and/or RvD1 (100 ng/ml), serum FBS-containing (10%) or serum-free growth medium for 24 h and visualized using a Zeiss AxioObserver fluorescence microscopy system. Phagokinetic tracks (black) produced as the cells (white dots) moved across the lawn of beads indicate the magnitude of cell movement. The lines within the images are due to breaks in image continuity. Due to the highly homogenous background the stitching software utilized had difficulty aligning the images. C: effect of Boc-2 on chemokinetic movement in Par-C10. Cells were treated with or without TNF-α (100 ng/ml) and subsequently treated with or without the ALX/FPR2 receptor antagonist Boc-2 (10 μM) for 30 min, and then cells were incubated with or without RvD1 (100 ng/ml) and chemokinetic movement was analyzed as described in Fig. 4B. D: effect of Boc-2 on Par-C10 cell chemotaxis. Cells were treated with or without the ALX/FPR2 receptor antagonist Boc-2 (10 μM) for 30 min, and then cells were incubated with or without RvD1 (100 ng/ml), and chemotaxis was analyzed as described in Fig. 4A. *P < 0.05 indicates significant differences from RvD1-treated cells. E: cell proliferation of Par-C10 cells. Cells were incubated in the presence or absence of RvD1 and/or TNF-α for 24 h and bromodeoxyuridine (BrdU) incorporation assay was performed as described in materials and methods. Results from a representative of 3 experiments are shown.
Fig. 5.
Fig. 5.
RvD1 receptor is expressed in salivary epithelium. A: lysates were prepared from Par-C10 cell monolayers and submandibular gland (SMG) cells freshly isolated from C57BL/6 mice and expression of ALX/FPR2 receptor was detected by Western blot analysis. Results from a representative of 3 experiments are shown. B: cell monolayers and frozen sections of mouse submandibular glands were fixed and expression of ALX/FPR2 was detected in SMG (visualized on the basolateral side of acinar cells, arrowheads) using immunofluorescence microscopy with rabbit anti-ALX/FPR2 (green). Images were obtained and analyzed using a Carl Zeiss 510 confocal microscope. The left image is rabbit anti-ALX/FPR2 stain (green); the center image is Hoechst nuclear stain (blue), and the right image is the merged image (green/blue). Par-C10 cells were stimulated with carbachol (C; 100 μM), UTP (D; 100 μM), or RvD1 (E; 100 ng/ml), and changes in the Fura-2 fluorescence ratio recorded at 340 nm and 380 nm were monitored, as described in materials and methods. Results from a representative of 3 experiments are shown for each agonist. F: representative Western blots of Par-C10 cells serum starved for 18 h and treated with or without RvD1 (100 ng/ml) for the indicated times. Protein extracts were subjected to SDS-PAGE and immunoblotted for either p-Akt or pan-Akt. G: data are expressed as fold increases in Akt phosphorylation induced by RvD1, compared with untreated control and represent the means ± SE of results from 3 or more experiments.
Fig. 6.
Fig. 6.
The selective PI3K inhibitor LY294002 blocks RvD1-mediated Par-C10 cell migration. A: Par-C10 cells were incubated with or without LY294002 (10 μM) for 30 min and chemotaxis assay was performed as described in Fig. 4. *P < 0.05 indicates significant differences from LY294002 + RvD1-treated cells. Par-C10 cells treated (C) with or (B) without LY294002 were incubated with RvD1 (100 ng/ml) in serum-free growth medium for 24 h and chemokinetic movement of cells was performed as described in Fig. 4. Results from a representative of 3 experiments are shown. As stated for Fig. 4, the lines within the images are due to breaks in image continuity. Due to the highly homogenous background the stitching software utilized had difficulty aligning the images.
Fig. 7.
Fig. 7.
RvD1-mediated cell migration in Par-C10 cells is decreased by Akt siRNA. A: Par-C10 cells were transfected with small interfering Akt RNA (100 nM) using Lipofectamine RNAiMAX, and chemotaxis assay was performed as described in Fig. 4. Cells transfected with nonspecific siRNA or treated with Lipofectamine alone served as controls. Par-C10 cells transfected with siRNAs or treated with RNAiMAX were incubated with RvD1 (100 ng/ml) in serum-free growth medium for 24 h, and chemokinetic movement of cells was performed and (B) quantitated as described in materials and methods. Results from a representative of 3 experiments are shown. C: total Akt expression was detected by Western blot analysis as described in materials and methods. Data represent the means ± SE of results from 3 experiments, where siRNA suppressed 55% of total protein expression. Results from a representative experiment are shown at the top of the figure.
Fig. 8.
Fig. 8.
Proposed signaling mechanisms mediated by RvD1 in Par-C10 cells. RvD1 binds to the ALX/FPR2 receptor and activates phosphatidylinositol 3-kinase (PI3K) and Akt signaling enhancing cell polarity (i.e., ZO-1 apical localization) and migration (i.e., actin stress fiber formation) and possibly blocking TNF-α signaling. Broken arrow indicates that mTORC2 is likely activated by PI3K. P indicates phosphorylated residue.

References

    1. Afonso PV, Ozden S, Prevost MC, Schmitt C, Seilhean D, Weksler B, Couraud PO, Gessain A, Romero IA, Ceccaldi PE. Human blood-brain barrier disruption by retroviral-infected lymphocytes: role of myosin light chain kinase in endothelial tight-junction disorganization. J Immunol 179: 2576–2583, 2007 - PubMed
    1. Alessi DR, Pearce LR, Garcia-Martinez JM. New insights into mTOR signaling: mTORC2 and beyond. Sci Signal 2: pe27, 2009 - PubMed
    1. Ariel A, Serhan CN. Resolvins and protectins in the termination program of acute inflammation. Trends Immunol 28: 176–183, 2007 - PubMed
    1. Arita M, Yoshida M, Hong S, Tjonahen E, Glickman JN, Petasis NA, Blumberg RS, Serhan CN. Resolvin E1, an endogenous lipid mediator derived from omega-3 eicosapentaenoic acid, protects against 2,4,6-trinitrobenzene sulfonic acid-induced colitis. Proc Natl Acad Sci USA 102: 7671–7676, 2005 - PMC - PubMed
    1. Baker OJ, Camden JM, Redman RS, Jones JE, Seye CI, Erb L, Weisman GA. Proinflammatory cytokines tumor necrosis factor-α and interferon-γ alter tight junction structure and function in the rat parotid gland Par-C10 cell line. Am J Physiol Cell Physiol 295: C1191–C1201, 2008 - PMC - PubMed

Publication types

MeSH terms

LinkOut - more resources