Randomized Controlled Trial
. 2012 Apr;55(4):1186-94.
doi: 10.1007/s00125-011-2435-7. Epub 2012 Jan 10.

Addition of insulin glargine or NPH insulin to metformin monotherapy in poorly controlled type 2 diabetic patients decreases IGF-I bioactivity similarly

Affiliations
Randomized Controlled Trial

Addition of insulin glargine or NPH insulin to metformin monotherapy in poorly controlled type 2 diabetic patients decreases IGF-I bioactivity similarly

A J Varewijck et al. Diabetologia. 2012 Apr.

Abstract

Aims/hypothesis: The aim of this study was to compare IGF-I bioactivity 36 weeks after the addition of insulin glargine (A21Gly,B31Arg,B32Arg human insulin) or NPH insulin to metformin therapy in type 2 diabetic patients who had poor glucose control under metformin monotherapy.

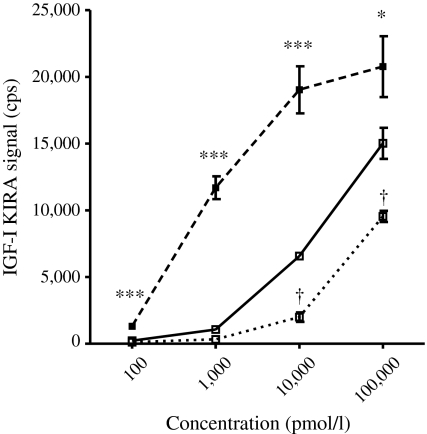
Methods: In the Lantus plus Metformin (LANMET) study, 110 poorly controlled insulin-naive type 2 diabetic patients were randomised to receive metformin with either insulin glargine (G+MET) or NPH insulin (NPH+MET). In the present study, IGF-I bioactivity was measured, retrospectively, in 104 out of the 110 initially included LANMET participants before and after 36 weeks of insulin therapy. IGF-I bioactivity was measured using an IGF-I kinase receptor activation assay.

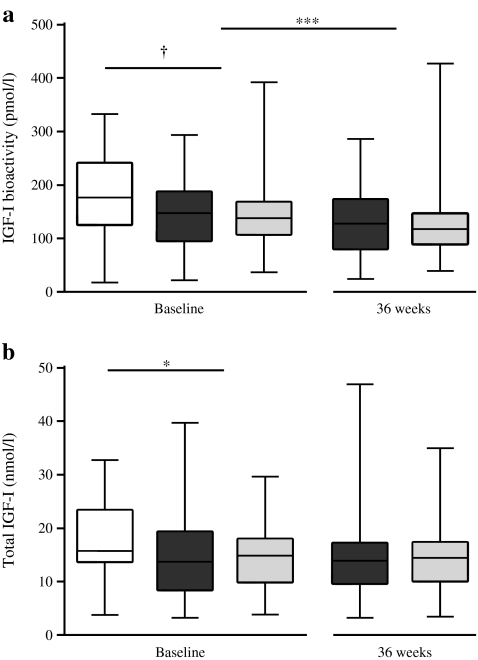
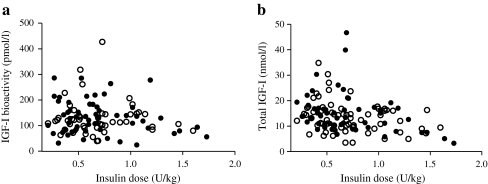
Results: After 36 weeks of insulin therapy, insulin doses were comparable between the G+MET (68 ± 5.7 U/day) and NPH+MET (71 ± 6.2 U/day) groups (p = 0.68). Before insulin therapy, circulating IGF-I bioactivity was similar between the G+MET (134 ± 9 pmol/l) and NPH+MET (135 ± 10 pmol/l) groups (p = 0.83). After 36 weeks, IGF-I bioactivity had decreased significantly (p = 0.001) and did not differ between the G+MET (116 ± 9 pmol/l) and NPH+MET (117 ± 10 pmol/l) groups (p = 0.91). At baseline and after insulin therapy, total IGF-I concentrations were comparable in both groups (baseline: G+MET 13.3 ± 1.0 vs NPH+MET 13.3 ± 1.0 nmol/l, p = 0.97; and 36 weeks: 13.4 ± 1.0 vs 13.1 ± 0.9 nmol/l, p = 0.71). Total IGF-I concentration did not change during insulin therapy (13.3 ± 0.7 vs 13.3 ± 0.7 nmol/l, baseline vs 36 weeks, p = 0.86).

Conclusions/interpretation: Addition of insulin glargine or NPH insulin to metformin monotherapy in poorly controlled type 2 diabetic patients decreases serum IGF-I bioactivity in a similar manner.


Figures

Fig. 1
Fig. 1
Activation of the IGF-IR: comparing human IGF-I (dashed line, black squares), insulin glargine (solid line, white squares) and NPH insulin (dotted line, white squares). Dose–response profiles ranged from 100 to 100,000 pmol/l. Points represent the mean value (+SEM) of three independent experiments. *p < 0.05 for human IGF-I vs insulin glargine and NPH insulin; ***p < 0.001 for human IGF-I vs insulin glargine and NPH insulin; p < 0.05 for insulin glargine vs NPH insulin
Fig. 2
Fig. 2
a IGF-I bioactivity (pmol/l) in non-diabetic participants (white box) at baseline and in diabetic participants in the G+MET group (dark grey boxes) and in the NPH+MET group (light grey boxes) at baseline and after 36 weeks of insulin treatment. The line in the boxes represents the mean of the data. The boxes extend from the 25th percentile to the 75th percentile values and the whiskers show the minimum and maximum values for each group. p = 0.09 for IGF-I bioactivity in non-diabetic participants at baseline vs IGF-I bioactivity in diabetic patients at baseline. ***p < 0.001 for IGF-I bioactivity at baseline vs IGF-I bioactivity at 36 weeks in all patients. b Total IGF-I (nmol/l) in non-diabetic participants (white box) at baseline and in diabetic participants in the G+MET group (dark grey boxes) and in the NPH+MET group (light grey boxes) at baseline and after 36 weeks of insulin treatment. *p = 0.03 for total IGF-I in non-diabetic participants at baseline vs total IGF-I in diabetic patients at baseline
Fig. 3
Fig. 3
Correlations between daily insulin dose and IGF-I bioactivity (a) and total IGF-I (b) in the G+MET (black dots) and NPH+MET (white dots) groups. a G+MET r = −0.17, p = 0.22; NPH+MET r = −0.08, p = 0.58. b G+MET r = −0.33, p = 0.01; NPH+MET r = −0.36, p = 0.02

Similar articles

Cited by

References

    1. Hemkens LG, Grouven U, Bender R, et al. Risk of malignancies in patients with diabetes treated with human insulin or insulin analogues: a cohort study. Diabetologia. 2009;52:1732–1744. doi: 10.1007/s00125-009-1418-4. - DOI - PMC - PubMed
    1. Jonasson JM, Ljung R, Talback M, Haglund B, Gudbjornsdottir S, Steineck G. Insulin glargine use and short-term incidence of malignancies-a population-based follow-up study in Sweden. Diabetologia. 2009;52:1745–1754. doi: 10.1007/s00125-009-1444-2. - DOI - PubMed
    1. Colhoun HM, SDRN Epidemiology Group Use of insulin glargine and cancer incidence in Scotland: a study from the Scottish Diabetes Research Network Epidemiology Group. Diabetologia. 2009;52:1755–1765. doi: 10.1007/s00125-009-1453-1. - DOI - PMC - PubMed
    1. Currie CJ, Poole CD, Gale EA. The influence of glucose-lowering therapies on cancer risk in type 2 diabetes. Diabetologia. 2009;52:1766–1777. doi: 10.1007/s00125-009-1440-6. - DOI - PubMed
    1. Food and Drug Administration (2011) FDA Drug Safety Communication: update to ongoing safety review of Lantus (insulin glargine) and possible risk of cancer. Available from www.fda.gov/Drugs/DrugSafety/ucm239376.htm, accessed 12 January 2011.

Publication types