. 2012 Apr 15;302(8):F928-40.
doi: 10.1152/ajprenal.00642.2011. Epub 2012 Jan 11.

Mechanisms of p53 activation and physiological relevance in the developing kidney

Affiliations

Mechanisms of p53 activation and physiological relevance in the developing kidney

Karam Aboudehen et al. Am J Physiol Renal Physiol. .

Abstract

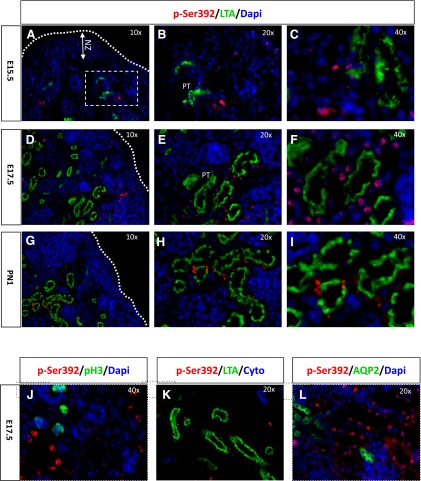
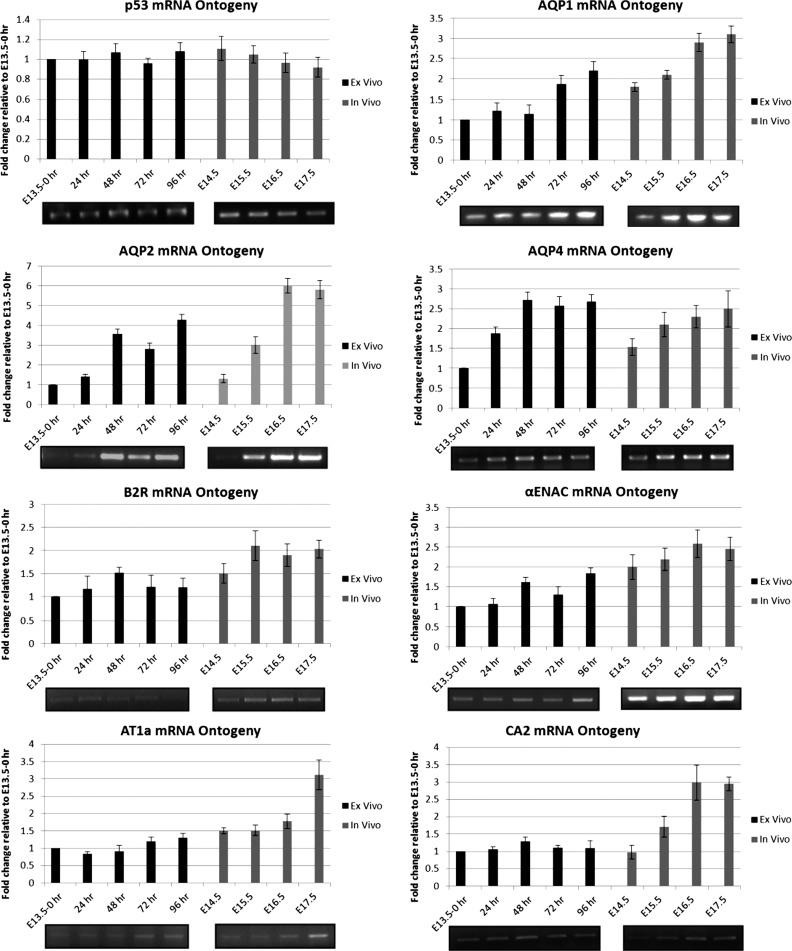
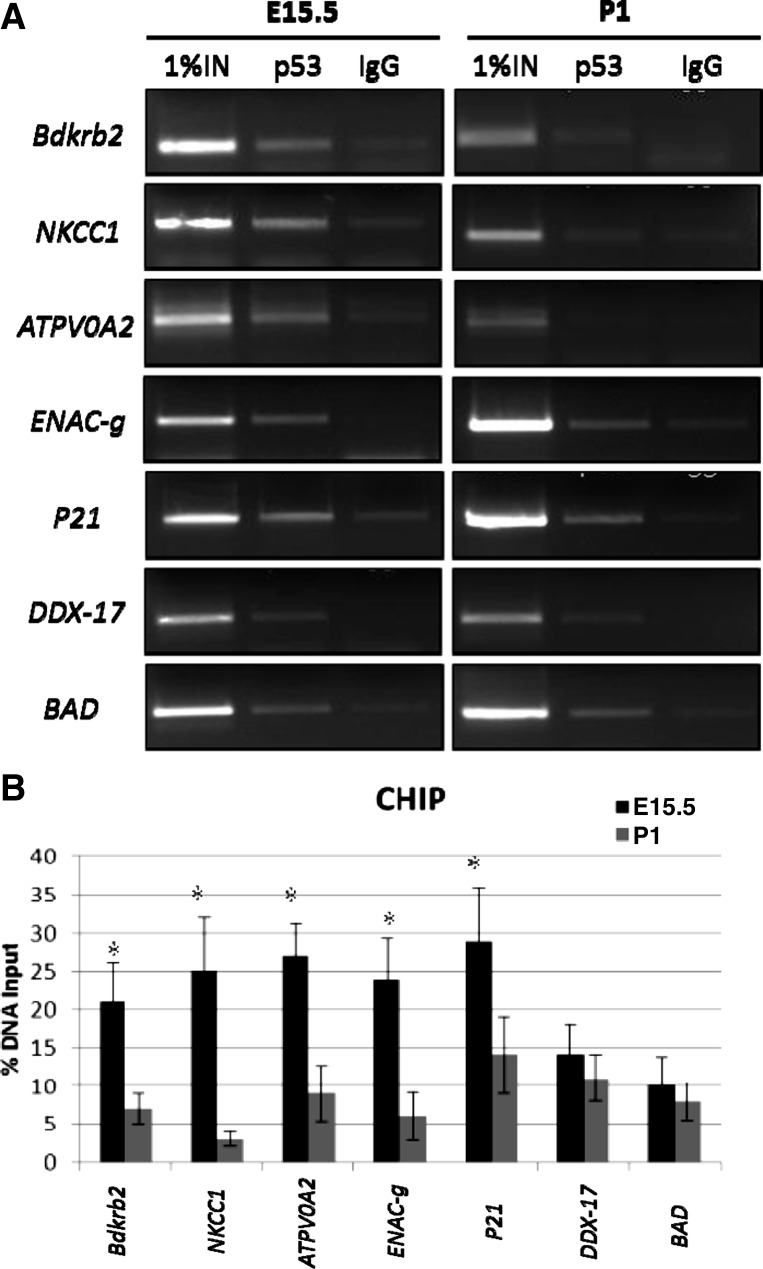
The tumor suppressor protein p53 is a short-lived transcription factor due to Mdm2-mediated proteosomal degradation. In response to genotoxic stress, p53 is stabilized via posttranslational modifications which prevent Mdm2 binding. p53 activation results in cell cycle arrest and apoptosis. We previously reported that tight regulation of p53 activity is an absolute requirement for normal nephron differentiation (Hilliard S, Aboudehen K, Yao X, El-Dahr SS Dev Biol 353: 354-366, 2011). However, the mechanisms of p53 activation in the developing kidney are unknown. We show here that metanephric p53 is phosphorylated and acetylated on key serine and lysine residues, respectively, in a temporal profile which correlates with the maturational changes in total p53 levels and DNA-binding activity. Site-directed mutagenesis revealed a differential role for these posttranslational modifications in mediating p53 stability and transcriptional regulation of renal function genes (RFGs). Section immunofluorescence also revealed that p53 modifications confer the protein with specific spatiotemporal expression patterns. For example, phos-p53(S392) is enriched in maturing proximal tubular epithelial cells, whereas acetyl-p53(K373/K382/K386) are expressed in nephron progenitors. Functionally, p53 occupancy of RFG promoters is enhanced at the onset of tubular differentiation, and p53 loss or gain of function indicates that p53 is necessary but not sufficient for RFG expression. We conclude that posttranslational modifications are important determinants of p53 stability and physiological functions in the developing kidney. We speculate that the stress/hypoxia of the embryonic microenvironment may provide the stimulus for p53 activation in the developing kidney.


Figures

Fig. 1.
Fig. 1.
Developmental changes in total and modified p53 in mouse kidneys. A: Western blot analysis of total p53 in nuclear extracts from embryonic (E), postnatal (PN), and adult kidneys. B: schematic of p53 posttranslational modifications investigated in this study. C and D: Western blot analysis of acetyl p53 and phosphorylated p53 in nuclear kidney extracts. Specificity of antibodies was tested in PN day 1 (PN1) p53+/+ and p53−/− whole kidney extracts. Equal protein loading was monitored by Ponceau S staining (not shown) and an anti-β-actin antibody. Acetylated and phosphorylated p53 densitometric values were normalized to total p53 values shown in A and expressed relative to the values on embryonic day 13.5 (E13.5).
Fig. 2.
Fig. 2.
Developmental changes in kidney p53 DNA-binding activity. A: EMSA with a 32P-labeled probe corresponding to the consensus p53-binding site in the Bdkrb2 promoter incubated with nuclear extract (NE) from E17.5 or H1299 cell lysate in the presence or absence of antibodies to ac-p53K373/K382 and p-p53Ser392. B and C: EMSA showing DNA-binding activity of labeled probe to kidney extracts at E13.5, E17.5, and PN1. For competition assays, 10- to 50-fold excess cold p53 oligonucleotide duplex was used. Lane 1, free probe; lane 2, probe in the presence of NE from the indicated stage; lane 3, probe in the presence of NE and competitor; lane 4, probe in the presence of NE and the indicated antibodies.
Fig. 3.
Fig. 3.
Posttranslational modifications are important for p53 protein stability. A: schematic of the p53 mutations tested in this study. B and C: Western blots of p53 protein in H1299 cells transfected with p53-mutant constructs (see text for details). Bottom: immunoblots for β-actin. D: densitometric analysis of p53 protein expression of mutant constructs relative to wild-type (WT) p53. Data in the graph represent means ± SE of at least 3 experiments. *P < 0.05 vs. WT p53.
Fig. 4.
Fig. 4.
Effects of p53 modifications on renal function gene (RFG) expression. WT and mutant p53 constructs were cotransfected along with promoter-reporter constructs of BdkrB2, AQP2, Agtr1a (AT1a), or PG13 into H1299 cells, and lysates were assayed for luciferase or CAT activity 24 h posttransfection (see text for details). The graphs show the change in reporter activity for the indicated constructs adjusted to WT p53, which was arbitrarily set to 1.00. Data in each graph represent means ± SE of at least 3 experiments (*P < 0.05).
Fig. 5.
Fig. 5.
Spatial expression of ac-p53K373/382 in the developing kidney. Immunofluorescence staining is shown in kidney sections using antibodies to ac-p53K373/K382, proliferating cell nuclear antigen (PCNA), neural cell-associated marker (NCAM), Lotus tetragonolobus lectin agglutinin (LTA), E-cadherin, aquaporin-2 (AQP2), and phospho-histone H3 (PH3). A–D: ac-p53K373/K382 is expressed in the nephrogenic zone (NZ) in embryonic and PN1 kidneys. E: ac-p53K373/K382 is enriched in NCAM-positive cap mesenchyme (CM). F: ac-p53K373/K382 is expressed in E-cadherin-positive epithelial tubules. G and H: ac-p53K373/K382 is expressed in maturing collecting ducts (CD) but not in proximal tubules (PT).
Fig. 6.
Fig. 6.
Spatial expression of ac-p53K386 in the developing kidney. Immunofluorescence staining is shown in kidney sections on E15.5 (A and B) or E17.5 (C and D) using antibodies to ac-p53K386, PCNA, E-cadherin, or AQP2. ac-P53K386 is expressed in proliferating cells of the NZ (A and B), ureteric bud branches (C), and collecting duct (D).
Fig. 7.
Fig. 7.
Spatial expression of p-p53Ser392 in the developing kidney. Immunofluorescence staining is shown of kidney sections using antibodies to ac-p53Ser392, LTA, PH3, PCNA, or AQP2. A–I: the NZ is devoid of ac-p53Ser392 but is enriched in differentiated proximal tubules (PT). ac-p53Ser392 is not expressed in dividing cells (J and K) or collecting ducts (L).
Fig. 8.
Fig. 8.
Developmental expression of RFGs in in vivo and ex vivo organ culture. RFG transcript levels in RNA samples from embryonic (E13.5, E14.5, E15.5, E16.5, E17.5) and organ cultured kidneys (E13.5+24, 48, 72, or 96 h) were determined by RT-PCR. Gene expression levels were normalized to GAPDH. The expression level at E13.5 was arbitrarily set to 1.0. Data in each graph represent means ± SE of at least 3 experiments. A representative ethidium bromide-stained gel is shown for each gene.
Fig. 9.
Fig. 9.
Occupancy of RFG promoters by p53 during nephron differentiation. A: representative gel images of chromatin immunoprecipitation (ChIP) experiments performed in embryonic (E15.5) and postnatal (PN1) kidneys using p53 (FL-393) antibody or control IgG. The precipitated chromatin was analyzed for p53 binding using primers for differentiation RFGs (Bdkrb2, NKCC1, ATPV0A2, ENAC-g, p21) and other p53 target genes (DDX-17, BAD). B: quantitative analysis of percentage of promoter-bound p53 for different target genes. Data are expressed in percent change relative to the amount of input DNA. Data in each graph represent means ± SD of at least 3 experiments (*P < 0.05).
Fig. 10.
Fig. 10.
Effect of altered p53 activity on RFG expression. p53−/− and UBMdm2−/− and WT littermate kidneys were harvested at E17.5, and extracted RNA was analyzed by qRT-PCR. For organ culture studies, metanephroi were dissected at E13.5 and incubated in the presence of pifithrin (PFT)-α (10 μM) or nutlin-3 (10 μM) for 96 h. Gene expression in PFT-α- or nutlin-treated kidneys was compared with control DMSO-treated kidneys, while expression in p53−/− and Ubmdm2−/− kidneys was compared with WT littermates. Data are expressed as relative fold-change from control/WT normalized at 1.0 (*P < 0.05).

Similar articles

Cited by

References

    1. Amariglio F, Tchang F, Prioleau MN, Soussi T, Cibert C, Mechali M. A functional analysis of p53 during early development of Xenopus laevis. Oncogene 15: 2191– 2199, 1997 - PubMed
    1. Armstrong JF, Kaufman MH, Harrison DJ, Clarke AR. High-frequency developmental abnormalities in p53-deficient mice. Curr Biol 5: 931– 936, 1995 - PubMed
    1. Ashcroft M, Kubbutat MH, Vousden KH. Regulation of p53 function and stability by phosphorylation. Mol Cell Biol 19: 1751– 1758, 1999 - PMC - PubMed
    1. Attardi LD, DePinho RA. Conquering the complexity of p53. Nat Genet 36: 7– 8, 2004 - PubMed
    1. Barlev NA, Liu L, Chehab NH, Mansfield K, Harris KG, Halazonetis TD, Berger SL. Acetylation of p53 activates transcription through recruitment of coactivators/histone acetyltransferases. Mol Cell 8: 1243– 1254, 2001 - PubMed

Publication types

LinkOut - more resources