Evaluation of biological sample preparation for immunosignature-based diagnostics
- PMID: 22237890
- PMCID: PMC3294604
- DOI: 10.1128/CVI.05667-11
Evaluation of biological sample preparation for immunosignature-based diagnostics
Abstract
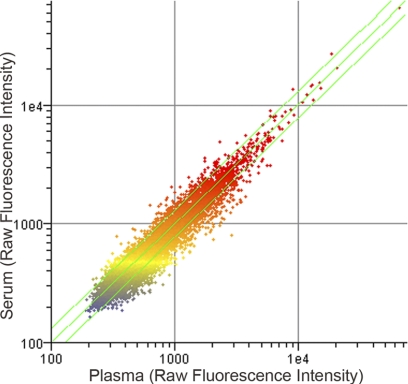
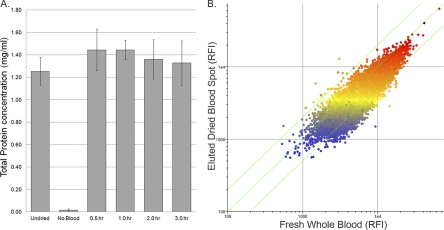
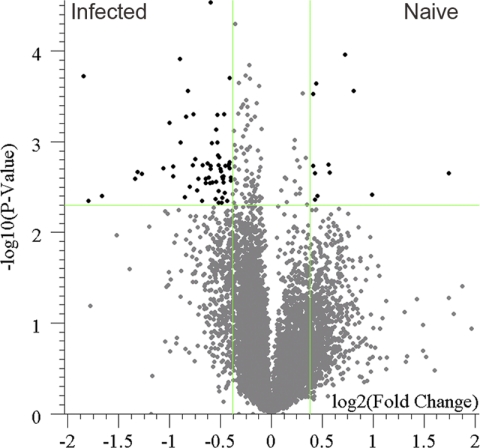
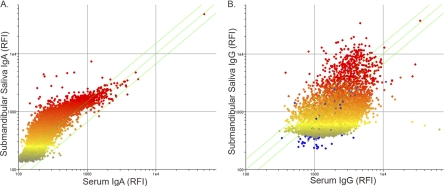
To address the need for a universal system to assess health status, we previously described a method termed "immunosignaturing" which splays the entire humoral antibody repertoire across a peptide microarray. Two important issues relative to the potential broad use of immunosignatures are sample preparation and stability. In the present study, we compared the immunosignatures developed from serum, plasma, saliva, and antibodies eluted from blood dried onto filter paper. We found that serum and plasma provide identical immunosignatures. Immunosignatures derived from dried blood also correlated well with those from nondried serum from the same individual. Immunosignatures derived from dried blood were capable of distinguishing naïve mice from those infected with influenza virus. Saliva was applied to the arrays, and the IgA immunosignature correlated strongly with that from dried blood. Finally, we demonstrate that dried blood retains immunosignature information even when exposed to high temperature. This work expands the potential diagnostic uses for immunosignatures. These features suggest that different forms of archival samples can be used for diagnosis development and that in prospective studies samples can be easily procured.
Figures
Similar articles
-
General Assessment of Humoral Activity in Healthy Humans.Mol Cell Proteomics. 2016 May;15(5):1610-21. doi: 10.1074/mcp.M115.054601. Epub 2016 Feb 22. Mol Cell Proteomics. 2016. PMID: 26902205 Free PMC article.
-
A general method for characterization of humoral immunity induced by a vaccine or infection.Vaccine. 2010 Jun 17;28(28):4529-37. doi: 10.1016/j.vaccine.2010.04.061. Epub 2010 May 5. Vaccine. 2010. PMID: 20450869
-
Immunosignatures can predict vaccine efficacy.Proc Natl Acad Sci U S A. 2013 Nov 12;110(46):18614-9. doi: 10.1073/pnas.1309390110. Epub 2013 Oct 28. Proc Natl Acad Sci U S A. 2013. PMID: 24167296 Free PMC article.
-
Statistical methods for analyzing immunosignatures.BMC Bioinformatics. 2011 Aug 19;12:349. doi: 10.1186/1471-2105-12-349. BMC Bioinformatics. 2011. PMID: 21854615 Free PMC article.
-
Immunosignature: Serum Antibody Profiling for Cancer Diagnostics.Asian Pac J Cancer Prev. 2015;16(12):4833-7. doi: 10.7314/apjcp.2015.16.12.4833. Asian Pac J Cancer Prev. 2015. PMID: 26163599 Review.
Cited by
-
General Assessment of Humoral Activity in Healthy Humans.Mol Cell Proteomics. 2016 May;15(5):1610-21. doi: 10.1074/mcp.M115.054601. Epub 2016 Feb 22. Mol Cell Proteomics. 2016. PMID: 26902205 Free PMC article.
-
Vaccines Meet Big Data: State-of-the-Art and Future Prospects. From the Classical 3Is ("Isolate-Inactivate-Inject") Vaccinology 1.0 to Vaccinology 3.0, Vaccinomics, and Beyond: A Historical Overview.Front Public Health. 2018 Mar 5;6:62. doi: 10.3389/fpubh.2018.00062. eCollection 2018. Front Public Health. 2018. PMID: 29556492 Free PMC article. Review.
-
Physical characterization of the "immunosignaturing effect".Mol Cell Proteomics. 2012 Apr;11(4):M111.011593. doi: 10.1074/mcp.M111.011593. Epub 2012 Jan 18. Mol Cell Proteomics. 2012. PMID: 22261726 Free PMC article.
-
Immunosignature system for diagnosis of cancer.Proc Natl Acad Sci U S A. 2014 Jul 29;111(30):E3072-80. doi: 10.1073/pnas.1409432111. Epub 2014 Jul 14. Proc Natl Acad Sci U S A. 2014. PMID: 25024171 Free PMC article. Clinical Trial.
-
Detecting viruses by using salivary diagnostics.J Am Dent Assoc. 2012 Oct;143(10 Suppl):12S-8S. doi: 10.14219/jada.archive.2012.0338. J Am Dent Assoc. 2012. PMID: 23034833 Free PMC article. Review.
References
-
- Ahmed FE. 2009. Sample preparation and fractionation for proteome analysis and cancer biomarker discovery by mass spectrometry. J. Separation Sci. 32: 771–798 - PubMed
-
- Boillot F, Peeters M, Kosia A, Delaporte E. 1997. Prevalence of the human immunodeficiency virus among patients with tuberculosis in Sierra Leone, established from dried blood spots on filter paper. Int. J. Tuberc. Lung Dis. 1: 493–497 - PubMed
-
- Bradley JS, Graham S, Picchio GR, Vugia DJ, Kharrazi M. 2011. Prevalence of hepatitis C virus antibody in newborn infants in Southern California in 2003. Pediatr. Infect. Dis. J. 30: 618–620 - PubMed
-
- Castro AC, Borges LG, Souza Rda S, Grudzinski M, D'Azevedo PA. 2008. Evaluation of the human immunodeficiency virus type 1 and 2 antibodies detection in dried whole blood spots (DBS) samples. Rev. Inst. Med. Trop. Sao Paulo 50: 151–156 - PubMed
-
- De Cock L, et al. 2004. Detection of HCV antibodies in oral fluid. J. Virol. Methods 122: 179–183 - PubMed
Publication types
MeSH terms
Substances
LinkOut - more resources
Full Text Sources
Other Literature Sources
Medical
Miscellaneous