Optimal foraging for specific nutrients in predatory beetles
- PMID: 22237910
- PMCID: PMC3321704
- DOI: 10.1098/rspb.2011.2410
Optimal foraging for specific nutrients in predatory beetles
Abstract
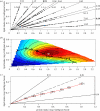
Evolutionary theory predicts that animals should forage to maximize their fitness, which in predators is traditionally assumed equivalent to maximizing energy intake rather than balancing the intake of specific nutrients. We restricted female predatory ground beetles (Anchomenus dorsalis) to one of a range of diets varying in lipid and protein content, and showed that total egg production peaked at a target intake of both nutrients. Other beetles given a choice to feed from two diets differing only in protein and lipid composition selectively ingested nutrient combinations at this target intake. When restricted to nutritionally imbalanced diets, beetles balanced the over- and under-ingestion of lipid and protein around a nutrient composition that maximized egg production under those constrained circumstances. Selective foraging for specific nutrients in this predator thus maximizes its reproductive performance. Our findings have implications for predator foraging behaviour and in the structuring of ecological communities.
Figures

Similar articles
-
Nutrient-specific compensation following diapause in a predator: implications for intraguild predation.Ecology. 2007 Oct;88(10):2598-608. doi: 10.1890/07-0012.1. Ecology. 2007. PMID: 18027762
-
Balancing of lipid, protein, and carbohydrate intake in a predatory beetle following hibernation, and consequences for lipid restoration.J Insect Physiol. 2016 May;88:1-9. doi: 10.1016/j.jinsphys.2016.02.004. Epub 2016 Feb 8. J Insect Physiol. 2016. PMID: 26868725
-
Nutrient-specific foraging in invertebrate predators.Science. 2005 Jan 7;307(5706):111-3. doi: 10.1126/science.1105493. Science. 2005. PMID: 15637278
-
Do wild carnivores forage for prey or for nutrients? Evidence for nutrient-specific foraging in vertebrate predators.Bioessays. 2015 Jun;37(6):701-9. doi: 10.1002/bies.201400171. Epub 2015 Mar 12. Bioessays. 2015. PMID: 25767065 Review.
-
Geometric analysis of nutrient balancing in the mealworm beetle, Tenebrio molitor L. (Coleoptera: Tenebrionidae).J Insect Physiol. 2014 Dec;71:37-45. doi: 10.1016/j.jinsphys.2014.10.001. Epub 2014 Oct 11. J Insect Physiol. 2014. PMID: 25308181
Cited by
-
Adaptive collective foraging in groups with conflicting nutritional needs.R Soc Open Sci. 2016 Apr 13;3(4):150638. doi: 10.1098/rsos.150638. eCollection 2016 Apr. R Soc Open Sci. 2016. PMID: 27152206 Free PMC article.
-
Comparison of Predatory Performance among Three Ladybird Species, Harmonia axyridis, Coccinella septempunctata and Hippodamia variegata, Feeding on Goji Berry Psyllid, Bactericera gobica.Insects. 2023 Dec 31;15(1):19. doi: 10.3390/insects15010019. Insects. 2023. PMID: 38249025 Free PMC article.
-
Two wild carnivores selectively forage for prey but not amino acids.Sci Rep. 2023 Feb 24;13(1):3254. doi: 10.1038/s41598-023-28231-w. Sci Rep. 2023. PMID: 36828827 Free PMC article.
-
Accelerometry reveals limits to use of an energy-saving anthropogenic food source by a threatened species: A case of Carnaby's cockatoos (Zanda latirostris) and canola.Ecol Evol. 2023 Oct 9;13(10):e10598. doi: 10.1002/ece3.10598. eCollection 2023 Oct. Ecol Evol. 2023. PMID: 37818246 Free PMC article.
-
Temperature effects on prey and basal resources exceed that of predators in an experimental community.Ecol Evol. 2018 Nov 26;8(24):12670-12680. doi: 10.1002/ece3.4695. eCollection 2018 Dec. Ecol Evol. 2018. PMID: 30619572 Free PMC article.
References
-
- Simpson S. J., Sibly R. M., Lee K. P., Behmer S. T., Raubenheimer D. 2004. Optimal foraging when regulating intake of multiple nutrients. Anim. Behav. 68, 1299–131110.1016/j.anbehav.2004.03.003 (doi:10.1016/j.anbehav.2004.03.003) - DOI - DOI
-
- Behmer S. T. 2009. Insect herbivore nutrient regulation. Ann. Rev. Entomol. 54, 165–18710.1146/annurev.ento.54.110807.090537 (doi:10.1146/annurev.ento.54.110807.090537) - DOI - DOI - PubMed
-
- Warbrick-Smith J., Raubenheimer D., Simpson S. J., Behmer S. T. 2009. Three hundred and fifty generations of extreme food specialisation: testing predictions of nutritional ecology. Entomol. Exp. Appl. 132, 65–7510.1111/j.1570-7458.2009.00870.x (doi:10.1111/j.1570-7458.2009.00870.x) - DOI - DOI
-
- Lee K. P., Simpson S. J., Clissold F. J., Brooks R., Ballard J. W. O., Taylor P. W., Soran N., Raubenheimer D. 2008. Lifespan and reproduction in Drosophila: new insights from nutritional geometry. Proc. Natl Acad. Sci. USA 105, 2498–250310.1073/pnas.0710787105 (doi:10.1073/pnas.0710787105) - DOI - DOI - PMC - PubMed
-
- Fanson B. G., Weldon C. W., Peréz-Staples D., Simpson S. J., Taylor P. W. 2009. Nutrients, not caloric restriction, extend lifespan in Queensland fruit flies (Bactrocera tryoni). Aging Cell 8, 514–52310.1111/j.1474-9726.2009.00497.x (doi:10.1111/j.1474-9726.2009.00497.x) - DOI - DOI - PubMed
Publication types
MeSH terms
Substances
Grants and funding
LinkOut - more resources
Full Text Sources

