

Prohibitin reduces mitochondrial free radical production and protects brain cells from different injury modalities
- PMID: 22238093
- PMCID: PMC3287080
- DOI: 10.1523/JNEUROSCI.2849-11.2012
Prohibitin reduces mitochondrial free radical production and protects brain cells from different injury modalities
Abstract
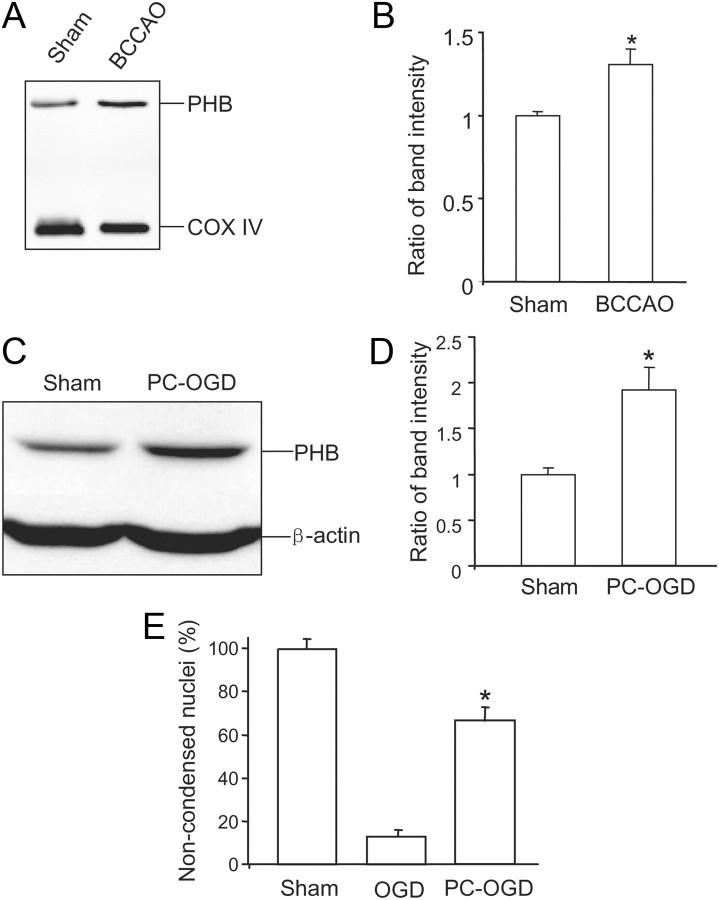
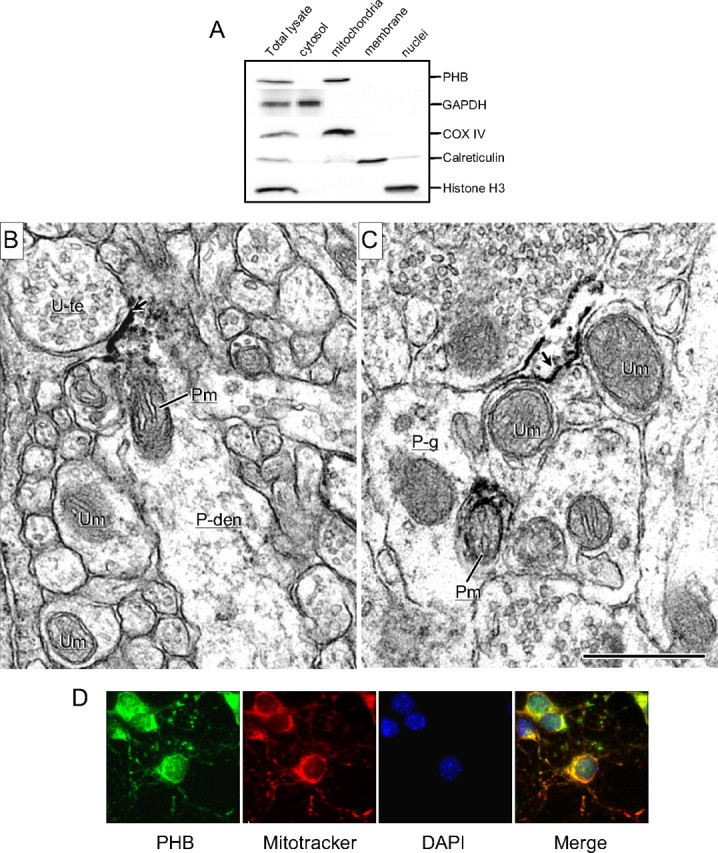
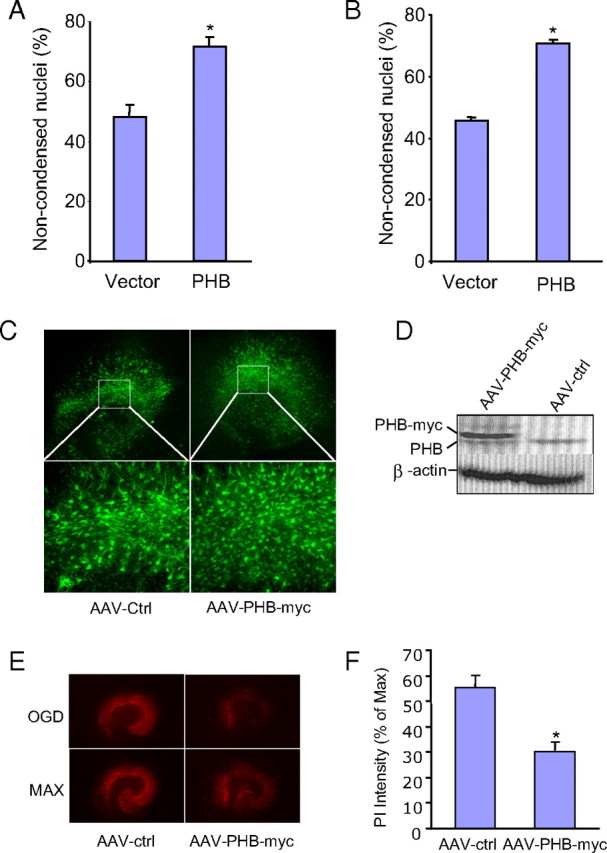
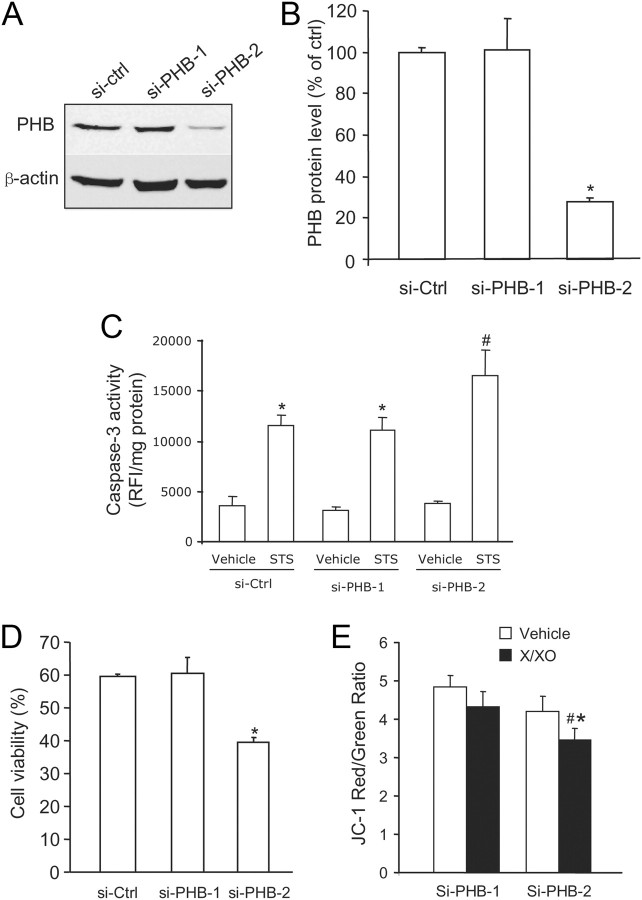
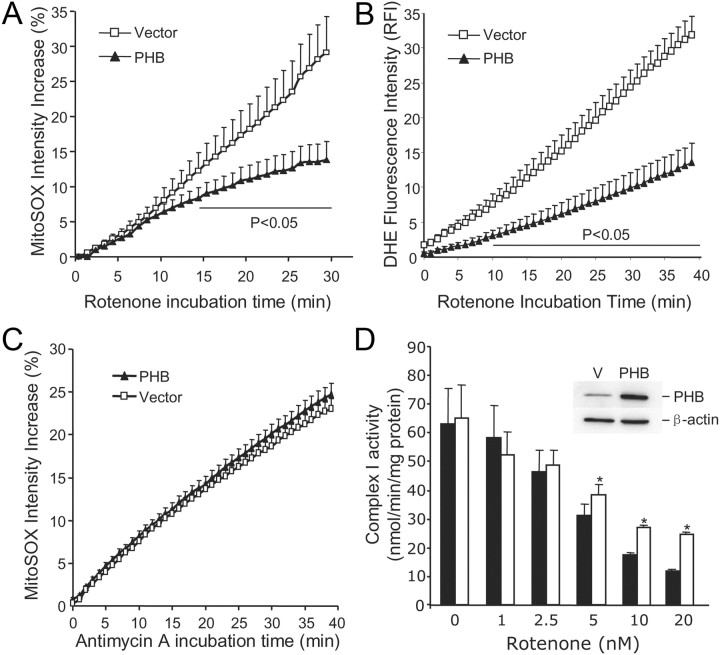
Prohibitin is an essential mitochondrial protein that has been implicated in a wide variety of functions in many cell types, but its role in neurons remains unclear. In a proteomic screen of rat brains in which ischemic tolerance was induced by electrical stimulation of the cerebellar fastigial nucleus, we found that prohibitin is upregulated in mitochondria. This observation prompted us to investigate the role of prohibitin in neuronal death and survival. We found that prohibitin is upregulated also in the ischemic tolerance induced by transient ischemia in vivo, or oxygen-glucose deprivation in neuronal cultures. Cell fractionation and electron-microscopic immunolabeling studies demonstrated that prohibitin is localized to neuronal mitochondria. Upregulation of prohibitin in neuronal cultures or hippocampal slices was markedly neuroprotective, whereas prohibitin gene silencing increased neuronal vulnerability, an effect associated with loss of mitochondrial membrane potential and increased mitochondrial production of reactive oxygen species. Prohibitin upregulation was associated with reduced production of reactive oxygen species in mitochondria exposed to the complex I inhibitor rotenone. In addition, prohibitin protected complex I activity from the inhibitory effects of rotenone. These observations, collectively, establish prohibitin as an endogenous neuroprotective protein involved in ischemic tolerance. Prohibitin exerts beneficial effects on neurons by reducing mitochondrial free radical production. The data with complex I activity suggest that prohibitin may stabilize the function of complex I. The protective effect of prohibitin has potential translational relevance in diseases of the nervous system associated with mitochondrial dysfunction and oxidative stress.
Figures


Similar articles
-
Prohibitin viral gene transfer protects hippocampal CA1 neurons from ischemia and ameliorates postischemic hippocampal dysfunction.Stroke. 2014 Apr;45(4):1131-8. doi: 10.1161/STROKEAHA.113.003577. Epub 2014 Mar 11. Stroke. 2014. PMID: 24619393 Free PMC article.
-
Prohibitin is a positive modulator of mitochondrial function in PC12 cells under oxidative stress.J Neurochem. 2018 Aug;146(3):235-250. doi: 10.1111/jnc.14472. J Neurochem. 2018. PMID: 29808474 Free PMC article.
-
Differential Protective Effects of Edaravone in Cerebellar and Hippocampal Ischemic Injury Models.Cerebellum. 2025 Feb 18;24(2):49. doi: 10.1007/s12311-025-01804-3. Cerebellum. 2025. PMID: 39964549 Free PMC article.
-
Prohibitin and mitochondrial biology.Trends Endocrinol Metab. 2009 Oct;20(8):394-401. doi: 10.1016/j.tem.2009.04.004. Epub 2009 Sep 3. Trends Endocrinol Metab. 2009. PMID: 19733482 Review.
-
Prohibitin function within mitochondria: essential roles for cell proliferation and cristae morphogenesis.Biochim Biophys Acta. 2009 Jan;1793(1):27-32. doi: 10.1016/j.bbamcr.2008.05.013. Epub 2008 Jun 17. Biochim Biophys Acta. 2009. PMID: 18558096 Review.
Cited by
-
Early-Onset Molecular Derangements in the Olfactory Bulb of Tg2576 Mice: Novel Insights Into the Stress-Responsive Olfactory Kinase Dynamics in Alzheimer's Disease.Front Aging Neurosci. 2019 Jun 11;11:141. doi: 10.3389/fnagi.2019.00141. eCollection 2019. Front Aging Neurosci. 2019. PMID: 31244650 Free PMC article.
-
Differential expression and regulation of prohibitin during curcumin-induced apoptosis of immortalized human epidermal HaCaT cells.Int J Mol Med. 2014 Mar;33(3):507-14. doi: 10.3892/ijmm.2014.1621. Epub 2014 Jan 9. Int J Mol Med. 2014. PMID: 24402549 Free PMC article.
-
Olfactory bulb neuroproteomics reveals a chronological perturbation of survival routes and a disruption of prohibitin complex during Alzheimer's disease progression.Sci Rep. 2017 Aug 22;7(1):9115. doi: 10.1038/s41598-017-09481-x. Sci Rep. 2017. PMID: 28831118 Free PMC article.
-
Analysis of the effect of the mitochondrial prohibitin complex, a context-dependent modulator of longevity, on the C. elegans metabolome.Biochim Biophys Acta. 2015 Nov;1847(11):1457-68. doi: 10.1016/j.bbabio.2015.06.003. Epub 2015 Jun 17. Biochim Biophys Acta. 2015. PMID: 26092086 Free PMC article.
-
Prohibitin ligands in cell death and survival: mode of action and therapeutic potential.Chem Biol. 2013 Mar 21;20(3):316-31. doi: 10.1016/j.chembiol.2013.02.006. Chem Biol. 2013. PMID: 23521790 Free PMC article. Review.
References
-
- Adibhatla RM, Hatcher JF. Citicoline decreases phospholipase A2 stimulation and hydroxyl radical generation in transient cerebral ischemia. J Neurosci Res. 2003;73:308–315. - PubMed
-
- Adibhatla RM, Hatcher JF. Lipid oxidation and peroxidation in CNS health and disease: from molecular mechanisms to therapeutic opportunities. Antioxid Redox Signal. 2010;12:125–169. - PubMed
-
- Ahn CS, Lee JH, Reum Hwang A, Kim WT, Pai HS. Prohibitin is involved in mitochondrial biogenesis in plants. Plant J. 2006;46:658–667. - PubMed
-
- Artal-Sanz M, Tavernarakis N. Prohibitin couples diapause signalling to mitochondrial metabolism during ageing in C. elegans. Nature. 2009;461:793–797. - PubMed
-
- Birch-Machin MA, Turnbull DM. Assaying mitochondrial respiratory complex activity in mitochondria isolated from human cells and tissues. Methods Cell Biol. 2001;65:97–117. - PubMed
Publication types
MeSH terms
Substances
Grants and funding
LinkOut - more resources
Full Text Sources
Other Literature Sources
Molecular Biology Databases