

Characterization of MADS-domain transcription factor complexes in Arabidopsis flower development
- PMID: 22238427
- PMCID: PMC3277181
- DOI: 10.1073/pnas.1112871109
Characterization of MADS-domain transcription factor complexes in Arabidopsis flower development
Abstract
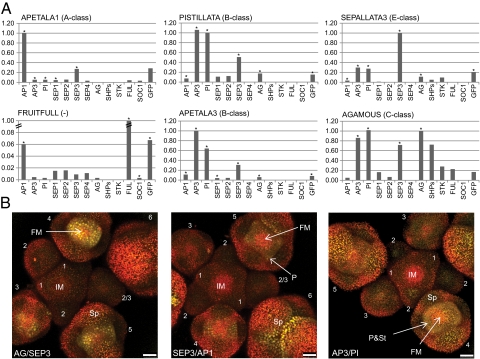
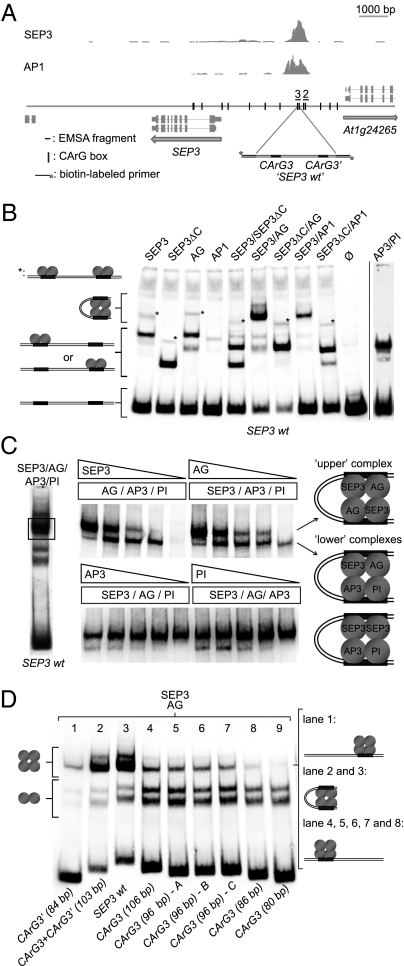
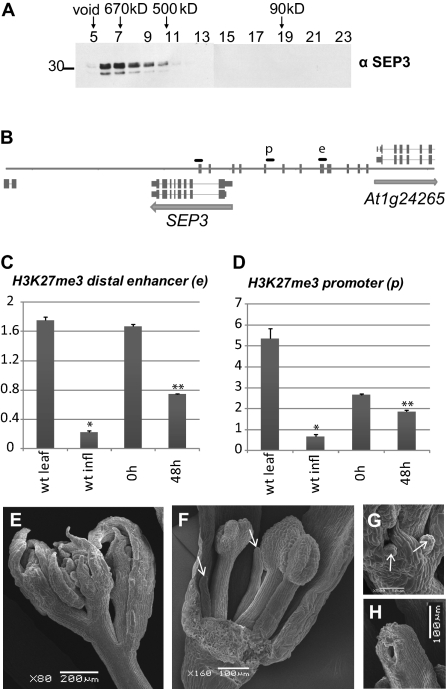
Floral organs are specified by the combinatorial action of MADS-domain transcription factors, yet the mechanisms by which MADS-domain proteins activate or repress the expression of their target genes and the nature of their cofactors are still largely unknown. Here, we show using affinity purification and mass spectrometry that five major floral homeotic MADS-domain proteins (AP1, AP3, PI, AG, and SEP3) interact in floral tissues as proposed in the "floral quartet" model. In vitro studies confirmed a flexible composition of MADS-domain protein complexes depending on relative protein concentrations and DNA sequence. In situ bimolecular fluorescent complementation assays demonstrate that MADS-domain proteins interact during meristematic stages of flower development. By applying a targeted proteomics approach we were able to establish a MADS-domain protein interactome that strongly supports a mechanistic link between MADS-domain proteins and chromatin remodeling factors. Furthermore, members of other transcription factor families were identified as interaction partners of floral MADS-domain proteins suggesting various specific combinatorial modes of action.
Conflict of interest statement
The authors declare no conflict of interest.
Figures
Similar articles
-
Intercellular transport of epidermis-expressed MADS domain transcription factors and their effect on plant morphology and floral transition.Plant J. 2010 Jul 1;63(1):60-72. doi: 10.1111/j.1365-313X.2010.04221.x. Epub 2010 Apr 2. Plant J. 2010. PMID: 20374529
-
Determination of floral organ identity by Arabidopsis MADS domain homeotic proteins AP1, AP3, PI, and AG is independent of their DNA-binding specificity.Mol Biol Cell. 1997 Jul;8(7):1243-59. doi: 10.1091/mbc.8.7.1243. Mol Biol Cell. 1997. PMID: 9243505 Free PMC article.
-
Recognition of floral homeotic MADS domain transcription factors by a phytoplasmal effector, phyllogen, induces phyllody.Plant J. 2014 May;78(4):541-54. doi: 10.1111/tpj.12495. Epub 2014 Apr 15. Plant J. 2014. PMID: 24597566 Free PMC article.
-
Molecular mechanisms of floral organ specification by MADS domain proteins.Curr Opin Plant Biol. 2016 Feb;29:154-62. doi: 10.1016/j.pbi.2015.12.004. Epub 2016 Jan 21. Curr Opin Plant Biol. 2016. PMID: 26802807 Review.
-
MADS-domain transcription factors and the floral quartet model of flower development: linking plant development and evolution.Development. 2016 Sep 15;143(18):3259-71. doi: 10.1242/dev.134080. Development. 2016. PMID: 27624831 Review.
Cited by
-
Tracing the Evolution of the SEPALLATA Subfamily across Angiosperms Associated with Neo- and Sub-Functionalization for Reproductive and Agronomically Relevant Traits.Plants (Basel). 2022 Oct 31;11(21):2934. doi: 10.3390/plants11212934. Plants (Basel). 2022. PMID: 36365387 Free PMC article.
-
Hydrangea arborescens 'Annabelle' Flower Formation and Flowering in the Current Year.Plants (Basel). 2023 Dec 7;12(24):4103. doi: 10.3390/plants12244103. Plants (Basel). 2023. PMID: 38140430 Free PMC article.
-
Expression pattern and subcellular localization of the ovate protein family in rice.PLoS One. 2015 Mar 11;10(3):e0118966. doi: 10.1371/journal.pone.0118966. eCollection 2015. PLoS One. 2015. PMID: 25760462 Free PMC article.
-
Arabidopsis FORGETTER1 mediates stress-induced chromatin memory through nucleosome remodeling.Elife. 2016 Sep 28;5:e17061. doi: 10.7554/eLife.17061. Elife. 2016. PMID: 27680998 Free PMC article.
-
A large-scale identification of direct targets of the tomato MADS box transcription factor RIPENING INHIBITOR reveals the regulation of fruit ripening.Plant Cell. 2013 Feb;25(2):371-86. doi: 10.1105/tpc.112.108118. Epub 2013 Feb 5. Plant Cell. 2013. PMID: 23386264 Free PMC article.
References
-
- Coen ES, Meyerowitz EM. The war of the whorls: Genetic interactions controlling flower development. Nature. 1991;353:31–37. - PubMed
-
- Pelaz S, Ditta GS, Baumann E, Wisman E, Yanofsky MF. B and C floral organ identity functions require SEPALLATA MADS-box genes. Nature. 2000;405:200–203. - PubMed
-
- Ditta G, Pinyopich A, Robles P, Pelaz S, Yanofsky MF. The SEP4 gene of Arabidopsis thaliana functions in floral organ and meristem identity. Curr Biol. 2004;14:1935–1940. - PubMed
-
- Honma T, Goto K. Complexes of MADS-box proteins are sufficient to convert leaves into floral organs. Nature. 2001;409:525–529. - PubMed
-
- Theissen G, Saedler H. Plant biology. Floral quartets. Nature. 2001;409:469–471. - PubMed
Publication types
MeSH terms
Substances
LinkOut - more resources
Full Text Sources
Other Literature Sources
Molecular Biology Databases
Research Materials
Miscellaneous
