

A dynamical model of oocyte maturation unveils precisely orchestrated meiotic decisions
- PMID: 22238511
- PMCID: PMC3252271
- DOI: 10.1371/journal.pcbi.1002329
A dynamical model of oocyte maturation unveils precisely orchestrated meiotic decisions
Abstract
Maturation of vertebrate oocytes into haploid gametes relies on two consecutive meioses without intervening DNA replication. The temporal sequence of cellular transitions driving eggs from G2 arrest to meiosis I (MI) and then to meiosis II (MII) is controlled by the interplay between cyclin-dependent and mitogen-activated protein kinases. In this paper, we propose a dynamical model of the molecular network that orchestrates maturation of Xenopus laevis oocytes. Our model reproduces the core features of maturation progression, including the characteristic non-monotonous time course of cyclin-Cdks, and unveils the network design principles underlying a precise sequence of meiotic decisions, as captured by bifurcation and sensitivity analyses. Firstly, a coherent and sharp meiotic resumption is triggered by the concerted action of positive feedback loops post-translationally activating cyclin-Cdks. Secondly, meiotic transition is driven by the dynamic antagonism between positive and negative feedback loops controlling cyclin turnover. Our findings reveal a highly modular network in which the coordination of distinct regulatory schemes ensures both reliable and flexible cell-cycle decisions.
Conflict of interest statement
The authors have declared that no competing interests exist.
Figures
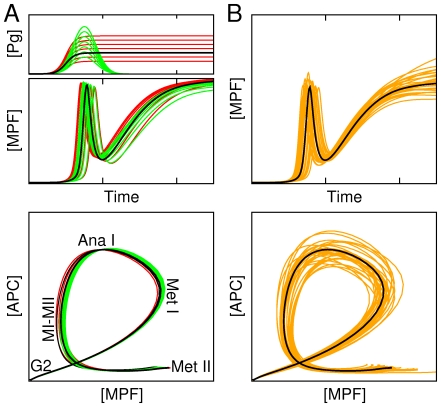
 (orange lines). Thick black lines correspond to the control case depicted in Fig. 2. In bottom panel of (A) is indicated the maturation stage (MetI: metaphase of meiosis I, AnaI: anaphase of meiosis I; MI-MII: transition from meiosis I to meiosis II; MetII: metaphase of meisosis II) associated with distinct portion of the state-space trajectory.
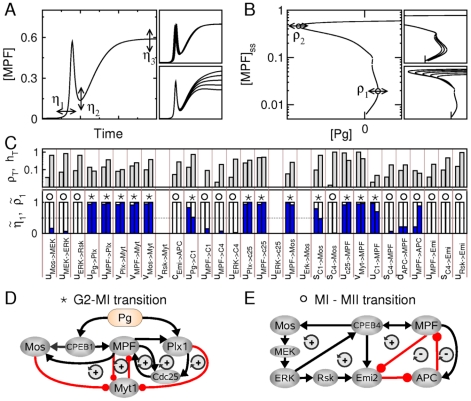
 ,
,  and
and  correspond to variations in timing of first MPF peak and in MPF levels at the MI/MII transition and at the metaphase II arrest, respectively, in response to parameter variations. Right-side panels show two examples where only
  or
or  indicators is sensitive to the parameter changed. (B) Schematic representation of the second sensitivity measure, where
  and
and  correspond to displacements of saddle points I and IV in the bifurcation diagram of Fig. 2B, in response to parameter variations. Right-side panels show two examples in which only one saddle-node bifurcation point is sensitive to the parameter changed. (C) Systematic calculation of normalized sensitivities for all interaction parameters of the model (see Eqs.1 and 2 with
  ,
,  ,
,  ,
,  and
and  ). The top panel shows the total sensitivities
  and
and  . The bottom panel shows the normalized sensitivities
  (left bar) and
  (right bar). Asterisks (resp., circles) indicate when
  (resp.,
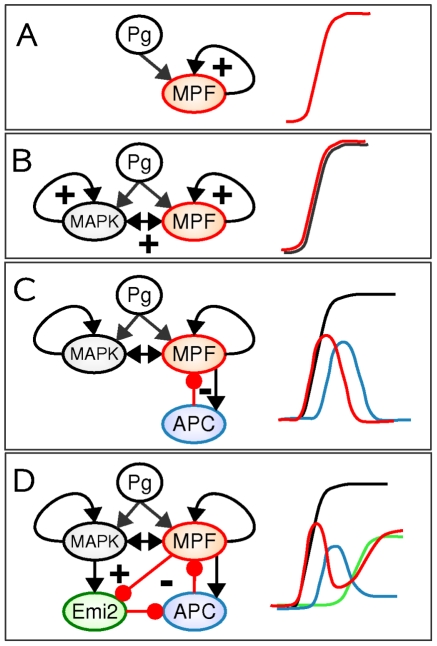
  ). (D,E) The initial network can be redrawn as two networks that control different stages of maturation process, namely the G2/MI and MI/MII transitions. The
  and
and  signs indicate the presence of positive and negative feedback loops, respectively.
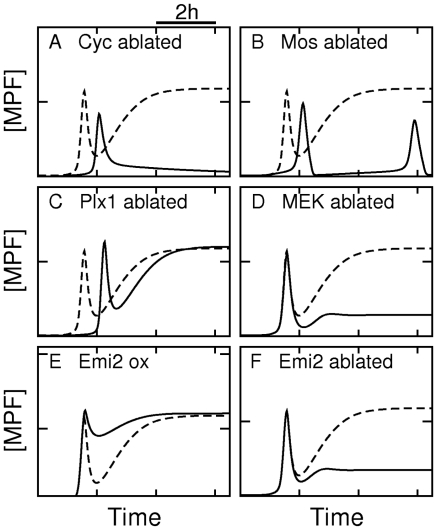
 ). (B) Ablation of Mos synthesis (
 ). (C) Ablation of Plx1 activity
  . (D) Ablation of MEK activity (
 ). (E) Overexpression of Emi2 (
 ). (F) Ablation of Emi2 synthesis (
 ).
).

References
-
- Nurse P. A long twentieth century of the cell cycle and beyond. Cell. 2000;100:71–78. - PubMed
-
- Marston AL, Amon A. Meiosis: cell-cycle controls shuffle and deal. Nat Rev Mol Cell Biol. 2004;5:983–998. - PubMed
-
- Kishimoto T. Cell-cycle control during meiotic maturation. Curr Opin Cell Biol. 2003;15:654–663. - PubMed
-
- Hochegger H, Klotzbucher A, Kirk J, Howell M, Guellec K, et al. New b-type cyclin synthesis is required between meiosis I and II during Xenopus oocyte maturation. Development. 2001;128:3795–37807. - PubMed
-
- Bodart JF, Baert FY, Sellier C, Duesbery NS, Flament S, et al. Differential roles of p39Mos-Xp42Mpk1 cascade proteins on Raf1 phosphorylation and spindle morphogenesis in xenopus oocytes. Dev Biol. 2005;283:373–383. - PubMed
Publication types
MeSH terms
Substances
LinkOut - more resources
Full Text Sources
