. 2012;7(1):e28213.
doi: 10.1371/journal.pone.0028213. Epub 2012 Jan 4.

Evidence for transcript networks composed of chimeric RNAs in human cells

Affiliations

Evidence for transcript networks composed of chimeric RNAs in human cells

Sarah Djebali et al. PLoS One. 2012.

Abstract

The classic organization of a gene structure has followed the Jacob and Monod bacterial gene model proposed more than 50 years ago. Since then, empirical determinations of the complexity of the transcriptomes found in yeast to human has blurred the definition and physical boundaries of genes. Using multiple analysis approaches we have characterized individual gene boundaries mapping on human chromosomes 21 and 22. Analyses of the locations of the 5' and 3' transcriptional termini of 492 protein coding genes revealed that for 85% of these genes the boundaries extend beyond the current annotated termini, most often connecting with exons of transcripts from other well annotated genes. The biological and evolutionary importance of these chimeric transcripts is underscored by (1) the non-random interconnections of genes involved, (2) the greater phylogenetic depth of the genes involved in many chimeric interactions, (3) the coordination of the expression of connected genes and (4) the close in vivo and three dimensional proximity of the genomic regions being transcribed and contributing to parts of the chimeric RNAs. The non-random nature of the connection of the genes involved suggest that chimeric transcripts should not be studied in isolation, but together, as an RNA network.


Conflict of interest statement

Competing Interests: The study was partially funded by Affymetrix Inc. PK, SF, IB, ED, J.Drenkow, AD and TG were employees of Affymetrix Inc. at the time of the study. There are no patents, products in development or marketed products to declare. This does not alter the authors' adherence to all the PLoS ONE policies on sharing data and materials, as detailed online in the guide for authors.

Figures

Figure 1
Figure 1. RACEarray experiment flowchart.
The successive steps of the RACEarray experiments are represented as a flowchart for both chromosomes 21 and 22. It should be read from left to right and from top to bottom.
Figure 2
Figure 2. RACEfrag transcription map statistics.
A- Distribution of RACEfrags among annotated genomic domains. The proportion of RACEfrags overlapping different annotated genic features is represented in this histogram. Blue: intronic RACEfrags; Light orange: exonic RACEfrags; Light grey: intergenic RACEfrags. The three categories on the X axis are, from left to right: (1) - external genic RACEfrags (i.e. RACEfrags falling within the boundaries of a gene not interrogated by RACE, (2) - intergenic RACEfrags, (3) - internal RACEfrags (i.e., RACEfrags detected within the RACE-primed gene). B- RACEfrag descriptive analysis. The top bar plot represents proportions of genomic domains covered by RACEfrags, and the bottom bar plot represents proportions of RACEfrags in different genomic domains (refinement of part A). As RACE is carried out in the two possible directions, 5′ and 3′, each bar plot is thus sub-divided into two sub-bar plots: proportions relative to 5′ RACEfrags in gray, and proportions relative to 3′ RACEfrags in blue. As expected: (1) RACEfrag coming from a given gene covers this gene more than any other gene; (2) for a given RACE-interrogated gene, internal exons and introns are equally covered by 5′ and 3′ RACEfrags, whereas 5′ most exons are more covered by 5′ RACEfrags and 3′ most exons by 3′ RACEfrags. The bottom bar plot also shows that most RACEfrags are exonic, then intronic and finally intergenic, and that exonic RACEfrags are first found in internal exons, then in most 3′ exons and finally in most 5′ exons.
Figure 3
Figure 3. Distribution of genomic distances between RACEfrags and their respective index RACE primers.
The raw histogram is shown in purple, the corresponding curve fit in red .
Figure 4
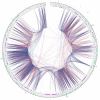
Figure 4. Transcriptional network on chromosome 22 in a pool of testis and prostate tissues.
The chromosome is depicted as a circle , and RACEfrag connections as inner links between genomic regions (5′ and 3′ RACE connections are red and blue, respectively). The circular tracks are, going inwards: (1) - chromosome scale (in megabases, starting at 14 Mb), (2) - plus-strand annotated genes (green), (3) - plus-strand annotated pseudogenes (black), (4) - minus-strand annotated genes (purple), (5) - minus-strand annotated pseudogenes (black).
Figure 5
Figure 5. Reciprocal gene/gene connections.
A - General definition of reciprocal gene/gene connections. Top panel: graphical illustration of reciprocity. Exons are symbolized by light blue boxes, introns by solid black lines. Dashed arrows, directed from the index exon to the RACEfrag, correspond to chimeric connections in distinct cell types, which are rendered in different colors. Two reciprocal gene/gene connections can be observed in this example, between genes A and B, and B and C. The (A–B) reciprocal pair is said to be (i), unique to cell type 2, and (ii), pure (i.e., its reciprocity is observed at least once in the same condition, cell type 2 in this example), whereas (B–C) is composite (i.e., its reciprocity can only be deduced from connections observed in different cell types). The counts of each connection type in this example are summarized in the tables in the bottom panel. B - Observed numbers of reciprocal gene/gene connections across 10 different cell types. This table is based on the template used in part A.
Figure 6
Figure 6. Experimental results from RT-PCR cloning and sequencing of chimeric connections.
A- Experimental design. The presence of a chimeric transcript between loci 1 and 2 was tested using a pair of nested primers, depicted as two black arrow heads at the bottom, targeting the index exon on one side, and the detected RACEfrag on the other side (both in orange). B- Annotation of novel locus-joining canonical splice sites in RT-PCR products. The three types of canonical exon junctions considered are enumerated at the bottom. C- Example of short genomic duplication around locus-joining exon junctions. Two alignments of such a junction are possible, as depicted in the bottom part of the figure. Intronic and exonic sequences are represented in lowercase and uppercase letters, respectively. Note that the duplicated sequence (in red letters) is present only once in the RT-PCR product. D- Results of the mapping of RT-PCR products to the genome. Detailed results for each genomic distance bin are reported. Statistics for RT-PCR sequences affected by the type of short duplications illustrated in Figure 6C are noted in pink, between parentheses. Results of the analysis of the coding potential in each category are presented in the rightmost column. RT-PCR products mapping “in trans” are products that include sequences from chromosomes other than the chromosome that contained the index gene and the connected RACEfrag.
Figure 7
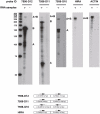
Figure 7. RNAse protection assays to validate predicted fusion/chimeric transcripts.
Each panel on top shows the autoradiographs of the probe that covers the predicted chimeric RNA fragment against human RNA from tissue pools detailed in table S2. In each panel, “+” and “−” indicate the tracks with presence and absence of input RNA, respectively. The RNA size ladder is shown on the left of the figure (unit: nucleotides). The bottom of the figure schematically shows the two components of each predicted chimeric transcript. For example, clone 7556-D12 contains 97 bases of an exon of gene TOP3D (designated A) joined to a 153-base exonic fragment of gene PIK4A (designated B); both fragments are in the same genome strand orientation (shown by arrows). In the top first panel corresponding to clone 7556-D12, the protected chimeric fragment in the RNA“+” lane is labeled A+B. The protected (non-chimeric) exons B and A are also shown. The other 2 validated chimeric fragments are shown in the second and third top panels. The fourth panel contains a control exon-exon junction of gene HIRA. The fifth panel contains a control actin gene fragment. A total of 3 out of 15 predicted and tested chimeric fragments were validated using this method. For more details on these experiments see Material and Methods, and for the genomic coordinates of the fragments see table S2.
Figure 8
Figure 8. Gene expression coordination within cliques as a function of clique size.
The width of the box plots is proportional to the number of connections involved in cliques of a given size. The number of observed cliques of sizes 2 to 7 is reported, as well as the numbers in randomized networks (mean, +/− standard deviation), in the form of a table at the bottom. Randomized networks are generated so that they have the same degree distribution as the original network (see Materials S1).
Figure 9
Figure 9. Characteristics of hub genes. A- Expression of hub genes.
The distribution of expression of the 74 hubs and of the 362 non hubs is plotted in blue and orange respectively. The expression of a gene is computed based on tiling array experiments performed on the same 16 cell lines and tissues as the RACE experiments (see details in the text). As we can see hubs tend to have higher expression values than non hubs. B- Phylogenetic conservation of hub genes. In each of the three gene network categories (i.e., hubs, non-hubs, and all RACEd genes), the proportion of genes having a detected ortholog in each eukaryotic species represented on the X axis (ordered by decreasing phylogenetic distance from human) is reported on the Y axis. Instances where the proportion of orthologs found in the hub category is significantly higher than for non-hubs (p<0.01, Fisher test) are marked with an asterisk.
Figure 10
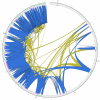
Figure 10. Reciprocal gene/gene connections supported by 5C on chromosome 21.
The 638 reciprocal gene/gene connections on chromosome 21 are represented as blue inner links if they are supported by 5C, and as yellow inner links otherwise.

References

    1. Kaessmann H. Origins, evolution, and phenotypic impact of new genes. Genome Res. 2010;20:1313–1326. - PMC - PubMed
    1. Wu X, Xiao H. Progress in the detection of human genome structural variations. Sci China C Life Sci. 2009;52:560–567. - PubMed
    1. Li H, Wang J, Mor G, Sklar J. A neoplastic gene fusion mimics trans-splicing of RNAs in normal human cells. Science. 2008;321:1357–1361. - PubMed
    1. Gingeras TR. Implications of chimaeric non-co-linear transcripts. Nature. 2009;461:206–211. - PMC - PubMed
    1. Denoeud F, Kapranov P, Ucla C, Frankish A, Castelo R, et al. Prominent use of distal 5′ transcription start sites and discovery of a large number of additional exons in ENCODE regions. Genome Res. 2007;17:746–759. - PMC - PubMed

Publication types

MeSH terms