. 2012;7(1):e29672.
doi: 10.1371/journal.pone.0029672. Epub 2012 Jan 4.

Kinome analysis of receptor-induced phosphorylation in human natural killer cells

Affiliations

Kinome analysis of receptor-induced phosphorylation in human natural killer cells

Sebastian König et al. PLoS One. 2012.

Abstract

Background: Natural killer (NK) cells contribute to the defense against infected and transformed cells through the engagement of multiple germline-encoded activation receptors. Stimulation of the Fc receptor CD16 alone is sufficient for NK cell activation, whereas other receptors, such as 2B4 (CD244) and DNAM-1 (CD226), act synergistically. After receptor engagement, protein kinases play a major role in signaling networks controlling NK cell effector functions. However, it has not been characterized systematically which of all kinases encoded by the human genome (kinome) are involved in NK cell activation.

Results: A kinase-selective phosphoproteome approach enabled the determination of 188 kinases expressed in human NK cells. Crosslinking of CD16 as well as 2B4 and DNAM-1 revealed a total of 313 distinct kinase phosphorylation sites on 109 different kinases. Phosphorylation sites on 21 kinases were similarly regulated after engagement of either CD16 or co-engagement of 2B4 and DNAM-1. Among those, increased phosphorylation of FYN, KCC2G (CAMK2), FES, and AAK1, as well as the reduced phosphorylation of MARK2, were reproducibly observed both after engagement of CD16 and co-engagement of 2B4 and DNAM-1. Notably, only one phosphorylation on PAK4 was differentally regulated.

Conclusions: The present study has identified a significant portion of the NK cell kinome and defined novel phosphorylation sites in primary lymphocytes. Regulated phosphorylations observed in the early phase of NK cell activation imply these kinases are involved in NK cell signaling. Taken together, this study suggests a largely shared signaling pathway downstream of distinct activation receptors and constitutes a valuable resource for further elucidating the regulation of NK cell effector responses.


Conflict of interest statement

Competing Interests: The authors Dr. König, Dr. Nimtz, Dr. Scheiter and Dr. Jänsch declare their affiliation to Helmholtz-Zentrum fuer Infektionsforschung GmbH. This does not alter the authors' adherence to all the PLoS ONE policies on sharing data and materials.

Figures

Figure 1
Figure 1. Functional characterization of IL-2–cultured primary NK cells.
(A) Intracellular Ca2+-mobilization induced by activating NK cell receptors. The following monoclonal antibodies (mAbs) were used for NK cell stimulation: negative controls, IgG isotype (cIgG, red) and anti-CD56 (dark blue); receptor stimulation, anti-2B4 (orange), anti-DNAM-1 (light blue), anti-CD16 (green) and anti-2B4 and anti-DNAM-1 (purple). Polyclonal IL-2–cultured NK cells were pre-incubated with the indicated mAbs on ice and loaded with Fluo-4 and Fura Red dyes. Ca2+-mobilization was assessed by flow cytometry. After 30 sec, secondary F(ab′)2 goat anti-mouse IgG crosslinking antibody was added (black arrow). FL-1/FL-3 ratios are plotted as a function of time. (B) Comparison of degranulation by freshly isolated (open bars) and IL-2–cultured (black bars) NK cells. NK cells were incubated with the following target cells: murine P815 cells (negative control), P815 cells coated with mAbs to the indicated receptors (Fc receptor-positive for redirected ADCC; IgG isotype and anti-CD56 mAb coated P815 cells were used as negative controls) or with NK cell-susceptible human K562 cells (positive control). Subsequently, NK cells were stained with fluorochrome-conjugated anti-CD56 and anti-CD107a mAbs and analyzed by flow cytometry. The percentage of CD107a-positive NK cells is shown as mean ± standard deviation (SD) of at least eight independent experiments. Differences between two groups were examined using the Student's t-test (***, p<0.001). Correlation between degranulation by freshly isolated (open bars) and IL-2–cultured (black bars) NK cells were determined according to Pearson (r = 0.95).
Figure 2
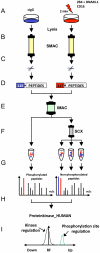
Figure 2. Proteome workflow for the detection of receptor-induced kinase phosphorylation in NK cells.
(A) Human, polyclonal, IL-2–cultured NK cells were stimulated each with the indicated receptor-specific monoclonal antibodies (mAbs) for 2 minutes (right side) and in all cases were comparatively analyzed with non-stimulated cells treated with control IgG isotype mAbs (cIgG) (left side). (B) Protein kinases were purified from total lysates using VI16743/Purvalanol-B-based small molecule affinity chromatography (SMAC). (C) Kinase elution and digestion into tryptic peptides comprising all non-modified and phosphorylated peptides. (D) Differential peptide labeling with iTRAQ reagents for MS-based quantification of phosphorylation site regulation and combination of samples. (E) Enrichment of phosphorylated peptides (phosphopeptides) by immobilized metal affinity chromatography (IMAC). (F) Further fractionation of non-phosphorylated peptide samples by strong cation exchange chromatography (SCX). (G) Peptide sequence analysis (LC-MS/MS) of all peptide fractions. (H) Peptide, kinase and phosphorylation site identification by Mascot database search and manual MS data inspection. (I) Statistical evaluation of significantly regulated phosphorylation sites on protein kinases by the MS-specific noise model iTRAQassist .
Figure 3
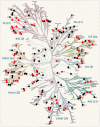
Figure 3. Protein kinases (kinome) expressed in human NK cells.
The figure shows the human kinome dendrogram . Kinase-selective proteomics revealed the expression of 170 protein kinases (black and red circles), 5 atypical kinases (not depicted) and 13 non-protein kinases (NPKs, not depicted). Phosphorylation site-specific information was obtained for 95 kinases (red circles), whereas no such information was obtained for the remaining kinases (black circles). Abbreviations: AGC, PKA/PKG/PKC-family kinases; CAMK, calcium/calmodulin-dependent kinases; CK1, casein kinases; CMGC, CDK/MAPK/GSK3/CLK-family kinases; RCG, receptor guanylate cyclases; STE, sterile homologue kinases; TK, tyrosine kinases; TKL, tyrosine kinase-like kinases; atypical protein kinases; Other, belonging to non of the mentioned groups. Human kinome provided courtesy of Cell Signaling Technology, Inc. www.cellsignal.com.
Figure 4
Figure 4. Quantification of kinase phosphorylation induced by activating NK cell receptors.
ITRAQ-based quantification and statistical analysis of kinase phosphorylation by iTRAQassist is exemplified for CD16- or 2B4 and DNAM-1-mediated phosphorylation of calcium/calmodulin-dependent protein kinase II gamma (KCC2G). (A) MS/MS fragmentation spectrum of a tryptic phosphopeptide derived from KCC2G. Peptide sequencing, protein identification and phosphorylation site annotation are based on fragment ions of the b- (red) and y- (blue) series. The sequence of the phosphopeptide (GSTESCNTTTEDEDLK) is shown in the upper part of the diagram. On the right, a magnification of the low molecular mass range is shown. The intensity of the iTRAQ reporter 114 correlates with the abundance of the respective phosphopeptide in IgG isotype control-treated (cIgG) NK cells, whereas the intensities of the 115 and 116 peaks represent 2B4 and DNAM-1 co-stimulated or CD16-stimulated cells. The MS/MS spectrum is derived from experiment II (see Table S1). (B) Statistical evaluation of CD16-induced KCC2G phosphorylation by iTRAQ assist. Statistical analyses of phosphopeptide regulation were performed by iTRAQassist as described previously . Most and less likely peptide regulations (x-axis: regulation factors, RF) were calculated and depicted as likelihood curves (y-axis) for individual phosphopeptides (green curves). The regulation of non-phosphorylated peptides assigned to KCC2G were calculated cumulatively and the resulting protein curve characterizes the general kinase abundance (expression) under the condition of stimulation (gray curve, “kinase regulation”). KCC2G was equally expressed in IgG isotype control-treated and CD16-stimulated NK cells. Only phosphorylation sites having regulation curves clearly separated from the protein curve were considered as regulated. CD16 stimulation (2 min) led to KCC2G phosphorylation on S381 and T382, but not on T287 (QETVECLR) or S311 (GAILTTMLVSR).
Figure 5
Figure 5. Identification of differentially phosphorylated FYN subsets in NK cells.
Nano ultra performance liquid chromatography (nano-UPLC) dissects distinct phosphorylation events at the same peptide DGSLNQSSGYR derived from the protein kinase FYN. MS analyses determined phosphorylations at the amino acid residues S21, S25, S26 and Y28. Successive elution of distinct phosphopeptides based on the same amino acid sequence facilitated the precise quantification of each phosphorylation event at FYN by MS (Figure S6). All phosphorylated serines showed a significantly induced phosphorylation following receptor engagements. However, the relative signal intensities of the distinct phosphopeptide populations indicate a predominant abundance of FYN phosphorylated on S21.
Figure 6
Figure 6. Kinase phosphorylation induced by engagement of CD16 or co-engagement of 2B4 and DNAM-1.
CD16- (two proteome experiments) or 2B4 and DNAM-1 co-activated (three proteome experiments) NK cells from two healthy human donors were analyzed in this study. (A) Kinases, which have previously been associated with NK cell signaling and/or function. (B) Putative novel CD16- and/or 2B4 and DNAM-1-dependent signaling components. 1)UniProt name of kinases and phosphorylation site annotation; regulation of phosphorylation site following 2)CD16 engagement or 3)2B4 and DNAM-1 co-activation is indicated as follows: green, up-regulated; red, down-regulated; gray, no statistical significant phosphorylation site regulation was detected; Number of (filled) circles indicates how often the significant regulation of a respective phosphorylation site was detected according to iTRAQassist (no overlap of protein and respective phosphopeptide regulation curves). Phosphorylation sites regulated with the same tendency, but not matching the criteria of statistical significance are marked as open circles. Proteome experiments that failed to detect a respective phosphorylation site are indicated by n.d. (not detected).

Similar articles

Cited by

References

    1. Vivier E, Tomasello E, Baratin M, Walzer T, Ugolini S. Functions of natural killer cells. Nat Immunol. 2008;9:503–510. - PubMed
    1. Caligiuri MA. Human natural killer cells. Blood. 2008;112:461–469. - PMC - PubMed
    1. Strowig T, Brilot F, Munz C. Noncytotoxic functions of NK cells: direct pathogen restriction and assistance to adaptive immunity. J Immunol. 2008;180:7785–7791. - PMC - PubMed
    1. Bryceson YT, March ME, Ljunggren HG, Long EO. Activation, coactivation, and costimulation of resting human natural killer cells. Immunol Rev. 2006;214:73–91. - PMC - PubMed
    1. Lanier LL. Up on the tightrope: natural killer cell activation and inhibition. Nat Immunol. 2008;9:495–502. - PMC - PubMed

Publication types

MeSH terms