. 2012;7(1):e29916.
doi: 10.1371/journal.pone.0029916. Epub 2012 Jan 4.

Automated reporter quantification in vivo: high-throughput screening method for reporter-based assays in zebrafish

Affiliations

Automated reporter quantification in vivo: high-throughput screening method for reporter-based assays in zebrafish

Steven L Walker et al. PLoS One. 2012.

Abstract

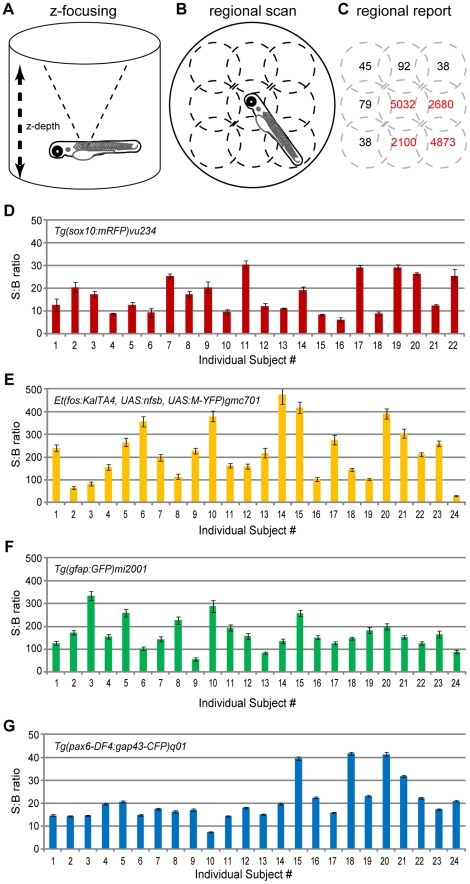
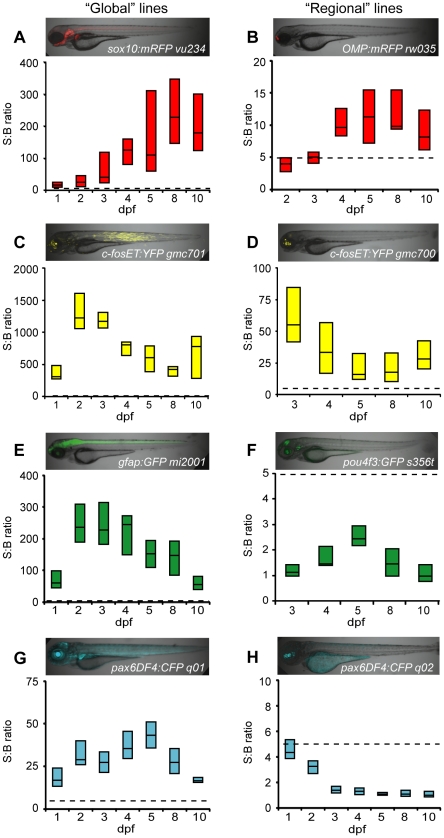
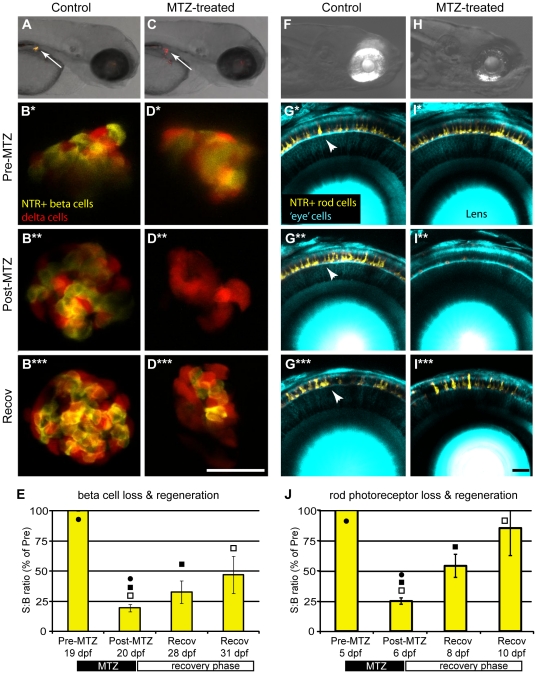
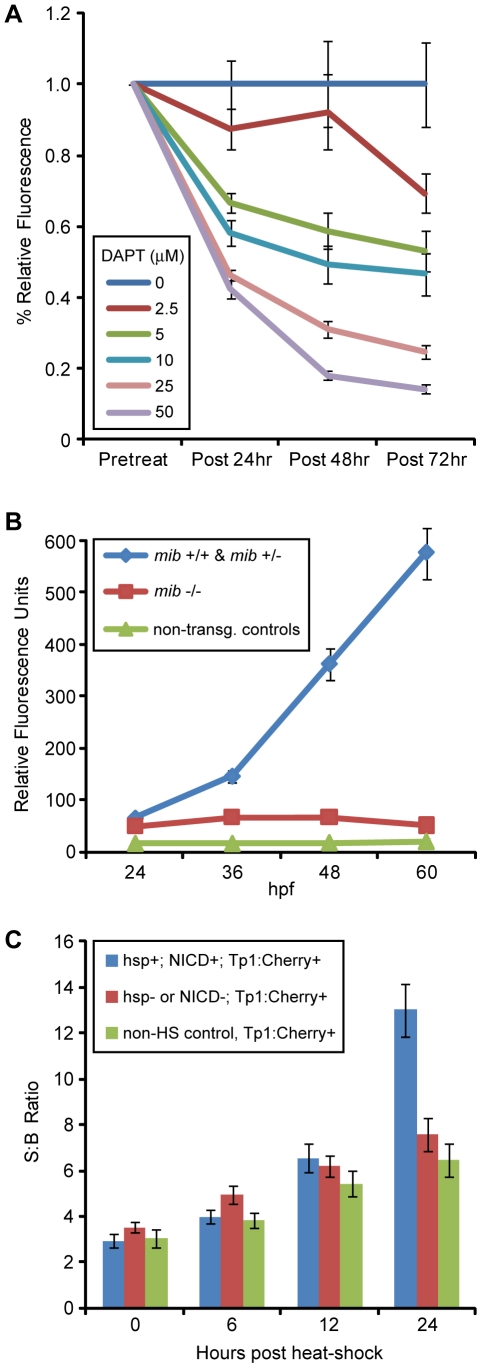
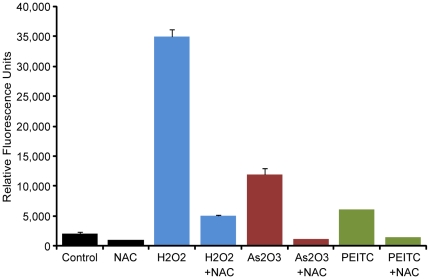
Reporter-based assays underlie many high-throughput screening (HTS) platforms, but most are limited to in vitro applications. Here, we report a simple whole-organism HTS method for quantifying changes in reporter intensity in individual zebrafish over time termed, Automated Reporter Quantification in vivo (ARQiv). ARQiv differs from current "high-content" (e.g., confocal imaging-based) whole-organism screening technologies by providing a purely quantitative data acquisition approach that affords marked improvements in throughput. ARQiv uses a fluorescence microplate reader with specific detection functionalities necessary for robust quantification of reporter signals in vivo. This approach is: 1) Rapid; achieving true HTS capacities (i.e., >50,000 units per day), 2) Reproducible; attaining HTS-compatible assay quality (i.e., Z'-factors of ≥0.5), and 3) Flexible; amenable to nearly any reporter-based assay in zebrafish embryos, larvae, or juveniles. ARQiv is used here to quantify changes in: 1) Cell number; loss and regeneration of two different fluorescently tagged cell types (pancreatic beta cells and rod photoreceptors), 2) Cell signaling; relative activity of a transgenic Notch-signaling reporter, and 3) Cell metabolism; accumulation of reactive oxygen species. In summary, ARQiv is a versatile and readily accessible approach facilitating evaluation of genetic and/or chemical manipulations in living zebrafish that complements current "high-content" whole-organism screening methods by providing a first-tier in vivo HTS drug discovery platform.


Conflict of interest statement

Competing Interests: The authors have read the journal's policy and have the following conflicts: JSM, JRM, and MTS declare competing financial interests. JSM has submitted a provisional patent for the use of plate readers to quantify reporter activity in living zebrafish. JSM has been awarded a patent on the use of prodrug converting enzyme systems in zebrafish to study regeneration (US patent # 7514595). JRM and MTS are employed at Luminomics Inc., a company that applies the techniques used in this manuscript to define compounds that promote the regeneration of genetically defined cell types. This does not alter the authors' adherence to all the PLoS ONE policies on sharing data and materials.

Figures

Figure 1
Figure 1. Signal variance across individuals and between fluorphores.
Schematics of the scan functions used to detect fluorescent reporters in transgenic zebrafish. A) Z-focus accounts for alternate well shape depth (e.g. conical) and organisms positioned above the nadir of the well. B) Regional scanning accounts for variations in orientations – shown is a 3×3 scan pattern (dotted line circles). C) Regionalized reporting serves to eliminate Background from Signal calculations (i.e., only regions in red are summed to calculate Total Signal). D–G) The fidelity of ARQiv detection was tested using 2 dpf hemizygous embryos of the indicated transgenic lines. Five full scanning sessions – each consisting of three independent scans averaged – were performed over the course of two hours. The resultant Signal to Background (S:B) ratio averages (± standard deviation) across scans per subject indicate that ARQiv detection of fluorescent reporters is highly reproducible. However, despite consistent detection per each individual, a high degree of variability across individuals and across transgenic lines is evident. At the extreme, this difference could be as much as an order of magnitude between sibling clutchmates (compare #14 to #24 in E). This finding indicates that accurate detection of changes in report expression requires signal levels to be normalized per each individual, optimally to pre-manipulation scan readings (see text for further details).
Figure 2
Figure 2. Comparison of fluorescent reporters.
Box plots of S:B ratios of transgenic lines expressing different fluorescent reporters across time: A–B) mRFP; C–D) EYFP; E–F) EGFP; G–H) ECFP. Micrographs show the expression patterns of each line. ARQiv scans were performed starting from the earliest day reporter could be detected through 10 dpf. All ‘global’ expressing lines (A,C,E,G) had S:B ratios consistent with excellent HTS assay quality (Z'-factor≥0.5 across ages tested, see Table 3). In contrast, only “red” fluorophore (B) and YFP (D) expressing “regional” lines produced S:B ratios consistent with HTS (see Table 3). Box plots: bottom line is the 25th percentile, top line the 75th percentile, interface between boxes represents the median (n = 8–24 subjects per line). Note: y-axis ranges differ markedly, dashed line indicates 5∶1 ratio of S:B for comparisons of levels across transgenic lines.
Figure 3
Figure 3. ARQiv detection of cell loss and regeneration.
Inducible cell-type specific ablation in nitroreductase (NTR) expressing transgenic fish , was used to test whether ARQiv could detect the loss and regeneration of fluorescently tagged cells: A–E) Tg(ins:PhiYFP-2A-nfsB, sst2:tagRFP)lmc01 – targeting pancreatic beta cells, and F–J) Double transgenic Tg(pax6-DF4:gap43-CFP)q01; Tg(-3.7rho:YFP-NTR)gmc500 – targeting retinal rod photoreceptors. Beta cell targeting: A) Non-treated control larvae showing PhiYFP-NTR-expressing (i.e., targeted) beta cells (yellow) and neighboring tagRFP-expressing (i.e., non-targeted) delta cells (red) in the pancreas (arrow). B-B*** series) Confocal time-lapse imaging shows reporter expression in beta and delta cells is stable in non-treated control larva from pre-treatment (B and B*, 3 dpf) through post-treatment (B**, 4 dpf) and recovery (B***, 10 dpf). C) MTZ-treated larvae showing loss YFP-NTR-expressing (i.e., targeted) pancreatic beta cells (arrow, absence of yellow). C–D series) Metronidazole (MTZ) treated larvae showing MTZ-induced loss of YFP-NTR-tagged beta cells (absence of yellow; C arrow, and D**, 4 dpf) and subsequent regeneration after MTZ wash out and recovery (D***, 10 dpf). Unperturbed reporter expression in neighboring tagRFP-tagged delta cells (red; C arrow, and D–D***) demonstrates the specificity of the technique. E) ARQiv data demonstrating that beta cell regeneration kinetics can be monitored in late larval to juvenile stage fish (19 to 31 dpf). Paired t-test p-values: • = 0.01, ▪ = 0.33, □ = 0.01. Rod photoreceptor targeting: F) Non-treated control larvae showing YFP-NTR-expressing rod cells (yellow) in eye. G–G***) Confocal time-lapse series showing YFP reporter expression in rod cells (arrowheads) is stable over time in non-treated control larva from pre-treatment (G, 5 dpf) through post-treatment (G*, 7 dpf) and recovery (G***, 10 dpf). H-I series) Metronidazole (MTZ) treated larvae showing MTZ-induced loss of YFP-NTR-tagged rod cells (reduction of yellow in H, and I**, 7 dpf) and subsequent regeneration after MTZ wash out and recovery (I***, 10 dpf). J) ARQiv data demonstrating that rod cell regeneration kinetics can be monitored in larval to fish (5 to 10 dpf); paired t-test p-values: • = 0.001, ▪ = 0.015, □ = 0.001. Data is presented as mean±standard error. All scale bars are 50 µm.
Figure 4
Figure 4. ARQiv detection of modulations in Notch pathway signaling.
A) Comparison of fluorescence levels in the Notch-signaling transgenic reporter line, Tp1:GFP treated with increasing concentrations of DAPT (an inhibitor of gamma-secretase proteolytic activity). Following pre-treatment scans at 48 hpf, DAPT treatments commenced and post-treatment scans were taken every 24 hrs thereafter until 120 hpf. The results show a concomitant decrease in Notch signaling with increasing DAPT concentration. Paired t-tests showed that all DAPT treatments of 5 µM and above are significantly different (p-value ≤0.05) than controls from post-24 hr onward. B) Comparison of fluorescence levels in Tp1:Cherry embryos within the context of the Notch pathway mutant mindbomb (mib). The mib mutation is believed to abrogate Notch-signaling by preventing normal function of the ligand Delta. Embryos from a mib/+; Tp1:Cherry incross were phenotypically screened at 24hpf to delineate mib (-/-), from wildtype (wt, +/+) and heterozygotes (het, +/-), as well as to identify non-transgenic siblings. Reporter expression levels were then quantified every 12 hrs thereafter until 60 hpf. The wt transgenic embryos show a steady increase in Notch reporter expression; however, the mib transgenic embryos show a constant low expression level near that of non-transgenic controls. Paired t-tests showed revealed the mib embryos produced significantly lower (p-value ≤0.05) reporter levels than wt and het siblings starting at 24 hpf. C) Comparison of fluorescence levels in Tp1:Cherry embryos within the context of Notch pathway activation following induction of NICD expression in Tp1:Cherry; hsp:Gal4; UAS:NICD triple transgenic larvae. Controls included both non-heat shocked Tp1:Cherry + siblings and heat-shocked Tp1:Cherry + siblings in which hsp:Gal4 and/or UAS:NICD was not present. Prior to heat shock a pre-treatment scan was performed at 4 dpf. An initial heat shock was performed to induce expression of NICD and repeated 12 hrs later. Scans were performed every 6 hrs over the next 24 hrs. Larvae with a slope of mCherry expression two standard deviations above non-heat shock controls were considered positive for all three transgenes and pooled. Larvae below this cut-off were considered to be negative for at least one of the other transgenes and pooled as heat-shocked negative controls. The data show that over-expression of NICD leads to a significant increase in expression of the mCherry reporter at 24 hours (p-value = 8.3E−06) post heat-shock in keeping with ligand-independent activation of the Notch pathway.
Figure 5
Figure 5. ARQiv detection of accumulated reactive oxygen species (ROS).
Comparison of fluorescent dye levels in wildtype DCFH-DA-treated zebrafish embryos exposed to the indicated agents for a total of 30 min exposure time. Results show significant increases in DCFH-DA fluorescence following exposure to agents known to induce oxidative stress. Treatment with the ROS scavenger NAC reduces fluorescence (see text for further details). Pair-wise t-test comparisons between agent-treated and agent + NAC-treated subjects resulted in the following p-values: H2O2 = 3.8E−10, As2O3 = 5.5E−07, PEITC = 9.8E−05. Abbreviations: NAC, N-acetylcysteine, (100 µM); H2O2, Hydrogen peroxide (1 mM), As2O3, Arsenic trioxide (10 µM), PEITC, Phenethyl isothiocyanate (5 µM).

References

    1. Eggeling C, Brand L, Ullmann D, Jager S. Highly sensitive fluorescence detection technology currently available for HTS. Drug Discov Today. 2003;8:632–641. - PubMed
    1. Clemons PA. Complex phenotypic assays in high-throughput screening. Curr Opin Chem Biol. 2004;8:334–338. - PubMed
    1. Lang P, Yeow K, Nichols A, Scheer A. Cellular imaging in drug discovery. Nat Rev Drug Discov. 2006;5:343–356. - PubMed
    1. Pardo-Martin C, Chang TY, Koo BK, Gilleland CL, Wasserman SC, et al. High-throughput in vivo vertebrate screening. Nat Methods. 2010;7:634–636. - PMC - PubMed
    1. Peravali R, Gehrig J, Giselbrecht S, Lutjohann DS, Hadzhiev Y, et al. Automated feature detection and imaging for high-resolution screening of zebrafish embryos. Biotechniques. 2011;50:319–324. - PubMed

Publication types

MeSH terms

Substances

LinkOut - more resources