Review
. 2012 Feb 23;55(4):1424-44.
doi: 10.1021/jm2010332. Epub 2012 Jan 12.

Rational approaches to improving selectivity in drug design

Affiliations
Review

Rational approaches to improving selectivity in drug design

David J Huggins et al. J Med Chem. .
No abstract available


Figures

Figure 1
Figure 1
Selectivity Strategies. This cartoon illustrates six design strategies based on five principles (shape, electrostatics, flexibility, hydration, and allostery) that can be employed to gain binding selectivity for a given target: (A) optimization of ligand charges specifically for the target and against the decoy; (B) displacement of a high-energy water molecule in the target that is not present in the decoy; (C) binding to an allosteric pocket in the target that is not present in the decoy; (D) creating a clash with the decoy receptor but not the target receptor, where the decoy is unable to alleviate the clash by structural rearrangement; (E) binding to a receptor conformation that is accessible in the target but inaccessible in the decoy; (F) creating an interaction with the target receptor but not the decoy receptor, where the decoy is unable to form the interaction by structural rearrangement. Note that (D) and (F) are different manifestations of the same underlying principle (shape complementarity), with (D) decreasing binding to the decoy through the introduction of a clash and (F) increasing binding to the target through the introduction of a favorable contact.
Figure 2
Figure 2
Shape complementarity in specific COX-2 inhibition. The crystal structure of COX-2 complex from PDB entry 6COX(32) overlaid with the apo crystal structure of COX-1 from PDB entry 3N8V. The ligand is displayed in atom colored space filling. The proteins are displayed as colored ribbons, and residues V523 from COX-2 and I523 from COX-1 are displayed as colored balls and sticks. The difference between the molecular surfaces of COX-2 residue V523 and COX-1 residue I523 is displayed in magenta.
Figure 3
Figure 3
Electrostatic complementarity in specific PTP1B inhibition: (A) structure of PTP1B in complex with a PTP1B specific cyclic amine from PDB entry 1C88; (B) structure of PTP1B in complex with a cyclic ether from PDB entry 1C87; (C) structure of the PTP1B R47V/D48N double mutant in complex with a PTP1B specific cyclic amine from PDB entry 1C86; (D) modeled structure of the PTP1B R47V/D48N double mutant in complex with a cyclic ether. The ligands are displayed as atom colored balls and sticks with green carbons and a transparent surface colored by electrostatic potential. The protein surfaces are displayed in wireframe and colored by electrostatic potential. Residues R47/V47 and D48/N48 are displayed in atom-colored ball and stick representation with gray carbons.
Figure 4
Figure 4
Charge optimization. (A) Affinity optimization, with a single well-defined minimum. The green line is the favorable Coulombic interaction between two opposite charges. The blue curve is the quadratic desolvation penalty, and the black line is the sum of the two (i.e., total electrostatic energy). Optimal charge is denoted with a black dot. (B) Specificity optimization with two proteins (red and orange curves). Only the total electrostatic energy is shown. The affinity optimal charge for each curve is denoted with a dot. The specificity optimal charge, which maximizes the energy difference between the curves, is denoted with a starburst. Note that the specificity optimum to the orange curve is theoretically unbounded but limits in chemical/biological reasonable charge space restrict the maximum charges. Furthermore, in most cases, high specificity is desirable but a baseline level of affinity (ΔGmax) to the primary target is needed to achieve efficacy, as shown by the light orange starburst.
Figure 5
Figure 5
Protein Flexibility of TACE and MMPs. S1′ loop in TACE and related MMPs showing conformational flexibility that leads to selectivity. (A) TACE structure 2FV5 (cyan) shows significant movement in the S1′ loop (red oval) to accommodate the larger quinolone ring of the 2FV5(91) inhibitor relative to the 3KMC(92) (orange) structure. (B) Overlays of TACE and MMP structures with the ligand from 2FV5 for reference showing side chains proximate to the quinolone ring in space filling representation. TACE crystal structure before induced fit (orange) shows clashes with the ligand. The small side chains in TACE allow loop movement that can accommodate the quinolone ring (cyan). The MMP-3 structure 2JT5(93) (green) and MMP-9 structure 2OW0(94) (yellow) with larger residues show that the ligand could not fit without substantial rearrangement of the S1′ loop, which might not be possible because the larger side chains make interactions with other protein residues that stabilize the loop (adjacent residues not shown for clarity). (C) TACE (3KMC, left) and MMP-9 (2OW0, right) with S1′ loop colored by B-factor (blue = low; red = high). Gly442 in TACE (circled in red) allows for increased flexibility of the S1′ loop.
Figure 6
Figure 6
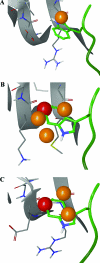
Water molecules in PDZ domains HTRA1, HTRA2, and HTRA3. Selectivity in the HTRA family of PDZ domains is predicted to arise from differences in binding site waters. HTRA1 (A, PDB entry 2JOA) does not have a strong preference for Trp at the P-1 position, losing only 6-fold in potency when mutated to Ala. However, HTRA2 (B, PDB entry 2PZD) and HTRA3 (C, PDB entry 2P3W) lose considerable binding potency when Trp is mutated to other residues, such as Ala (over 300-fold for HTRA2 and 450-fold for HTRA3). Hydration site free energies are computed with the WaterMap program, and only high-energy hydration sites in the P-1 pocket are shown. Red sites are greater than 4.0 kcal/mol and orange sites are greater than 2.0 kcal/mol unfavorable relative to bulk water. HTRA2 and HTRA3 are computed to gain a substantial amount of free energy from the displacement of high-energy hydration sites, whereas HTRA1 gains significantly less. Importantly, Trp is the only side chain that is able to displace all of the high-energy hydration sites in the P-1 pocket of HTRA2 and HTRA3. The peptide backbone is shown in green with only the P-1 Trp side chain displayed.
Figure 7
Figure 7
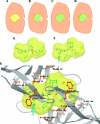
Substrate envelope hypothesis. To achieve broad binding selectivity against an enzyme target and the collection of its functional mutants, a useful approach has been to develop inhibitors that bind within and do not extend beyond the envelope created by the outer shape of the substrate (or a collection of substrates) bound to the active site. The idea is illustrated in panels A–D, and an example from HIV-1 protease is given in panels E–G. (A) The parent target protein is shown in orange outline and shading, and a bound substrate is shown in yellow with the substrate envelope indicated by the yellow outline. (B) An inhibitor (green shading) that binds within the substrate envelope (yellow outline) binds not only the parent target (orange outline) but also a mutant (orange shading) that includes positions that protrude further into the active site (left side) and that retreat away from the site (right side). (C) A different inhibitor (green shading) that extends beyond the substrate envelope (yellow outline) might make better interactions with the parent target (orange outline and shading) and even bind with higher affinity than other inhibitors. (D) However, such an envelope-violating inhibitor may bind poorly to protein mutants (orange shading) that differ from the parent (orange outline) by protruding further into the active site and introduce a potential clash with the inhibitor (left side, green hatching) or by retreating away from the active site and remove a stabilizing interaction (right side, orange hatching). Interestingly, there is a preponderance of the “retreating” mutations over the “protruding” ones for HIV-1 protease, perhaps because of molecular plasticity issues. (E) An HIV-1 protease inhibitor that binds with high affinity to wild-type HIV-1 proteases as well as to mutants is shown to reside within the substrate envelope (yellow surface) in its crystal structure in the protein complex (the protein has been removed for clarity). (F, G) HIV-1 protease inhibitor saquinavir from PDB entry 3OXC, which binds well to wild-type HIV-1 proteases but is susceptible to resistance mutants, is shown to extend outside the substrate envelope (yellow surface) in its crystal structure (the protein has been removed for clarity in panel F but is present in panel G, in which some side chains associated with resistance mutations have been highlighted and labeled).
Figure 8
Figure 8
Targeting drugs to cellular transporters. A cartoon illustrating the mechanism by which selectivity is achieved from linking drug molecules to targets of membrane transporters. Passive transport of molecules across membranes is a slow process and is in competition with rapid clearance (bottom). Active uptake by membrane bound transporters such as GRP78 (top left) or LAT1/GLUT1 (top right) allows drug molecules to be targeted toward particular cells or organs.

References

    1. Lazaridis T. Binding Affinity and Specificity from Computational Studies. Curr. Org. Chem. 2002, 6, 1319–1332.
    1. Cheng A. C.Predicting Selectivity and Druggability in Drug Discovery. In Annual Reports in Computational Chemistry; Wheeler R. A., Spellmeyer D. C., Eds.; Elsevier: Amsterdam, 2008; Vol. 4, Chapter 2, pp 23–37.
    1. Ortiz A. R.; Gomez-Puertas P.; Leo-Macias A.; Lopez-Romero P.; Lopez-Vinas E.; Morreale A.; Murcia M.; Wang K. Computational Approaches to Model Ligand Selectivity in Drug Design. Curr. Top. Med. Chem. 2006, 6, 41–55. - PubMed
    1. Gleeson M. P.; Hersey A.; Montanari D.; Overington J. Probing the Links between in Vitro Potency, ADMET and Physicochemical Parameters. Nat. Rev. Drug Discovery 2011, 10, 197–208. - PMC - PubMed
    1. Cavalli A.; Poluzzi E.; De Ponti F.; Recanatini M. Toward a Pharmacophore for Drugs Inducing the Long QT Syndrome: Insights from a CoMFA Study of HERG K+ Channel Blockers. J. Med. Chem. 2002, 45, 3844–3853. - PubMed

Publication types