. 2012 Feb 16;116(6):1884-900.
doi: 10.1021/jp2074804. Epub 2012 Feb 3.

Interaction of I50V mutant and I50L/A71V double mutant HIV-protease with inhibitor TMC114 (darunavir): molecular dynamics simulation and binding free energy studies

Affiliations

Interaction of I50V mutant and I50L/A71V double mutant HIV-protease with inhibitor TMC114 (darunavir): molecular dynamics simulation and binding free energy studies

Biswa Ranjan Meher et al. J Phys Chem B. .

Abstract

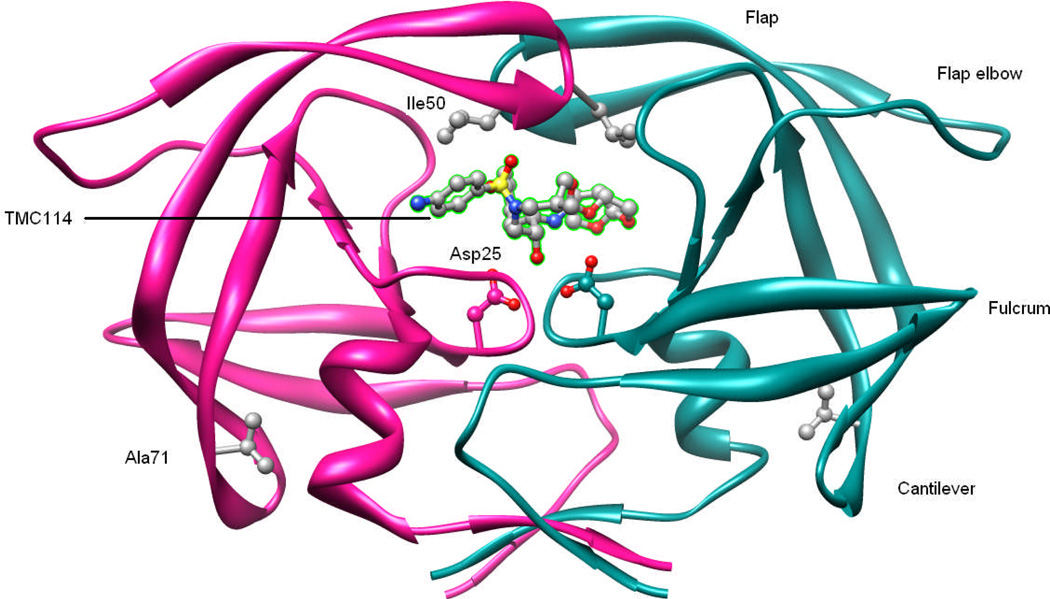
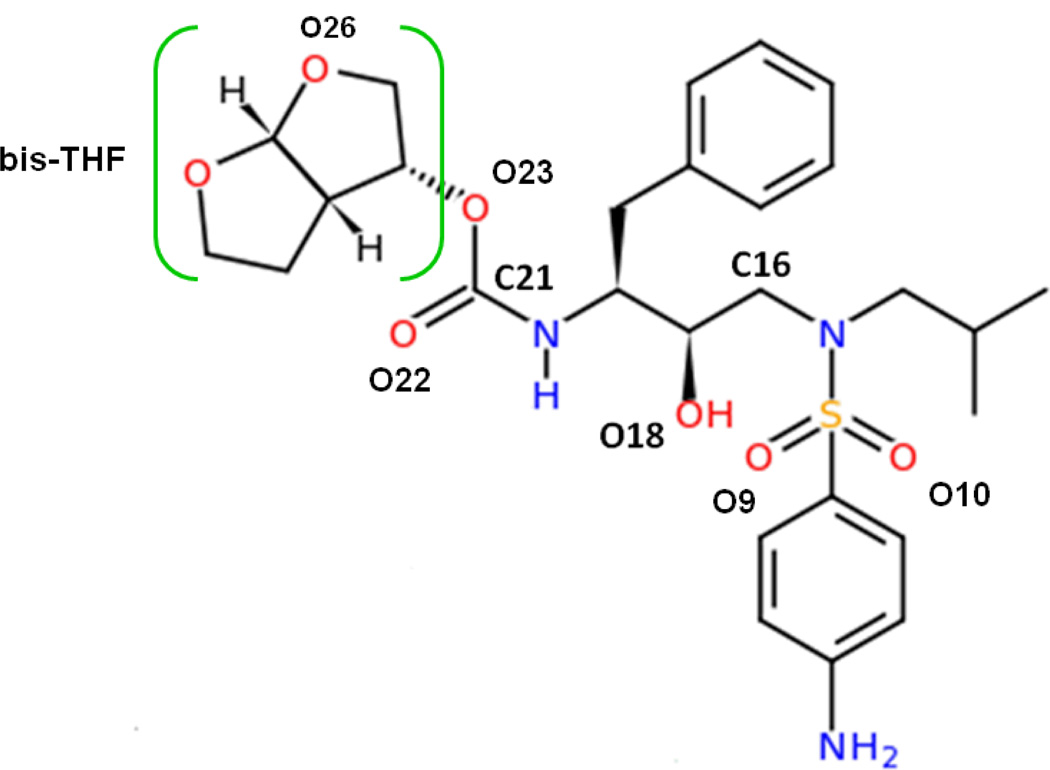
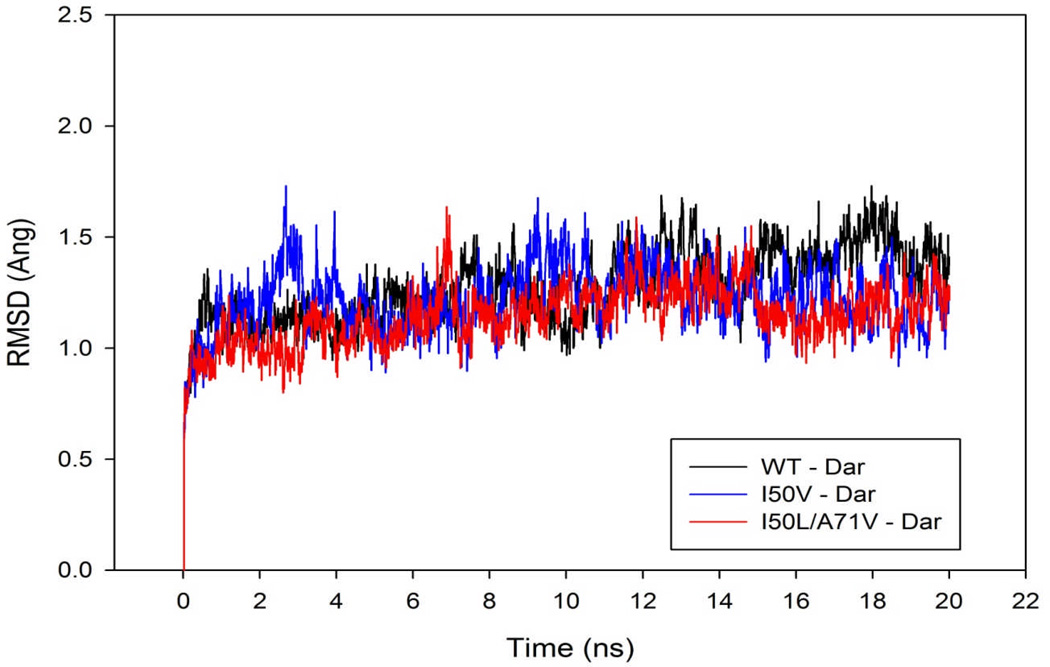
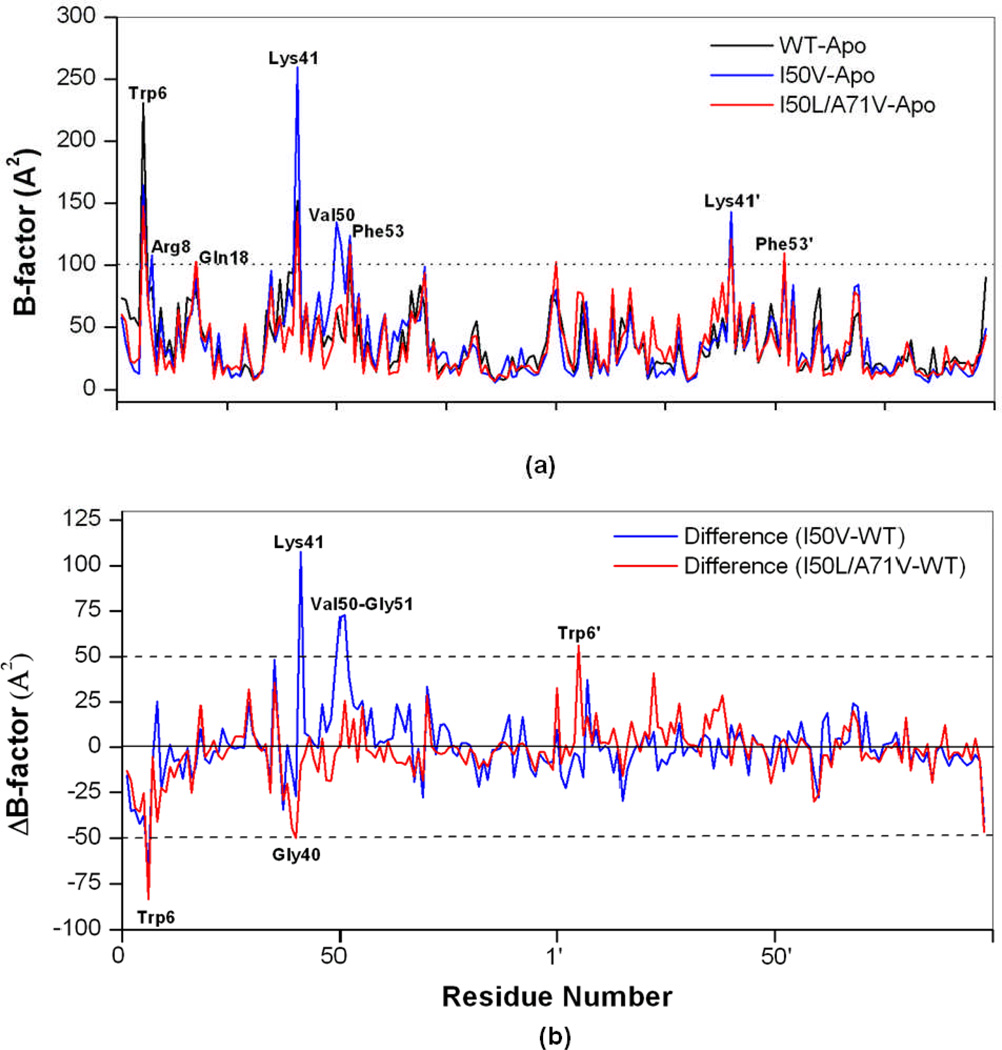
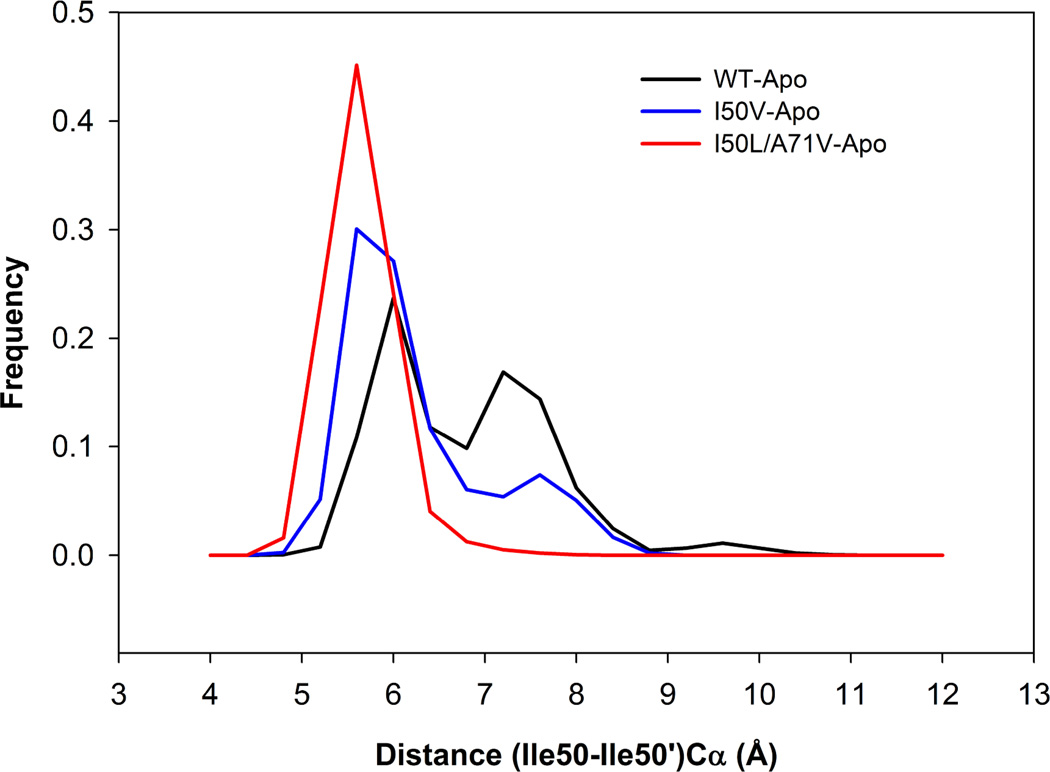
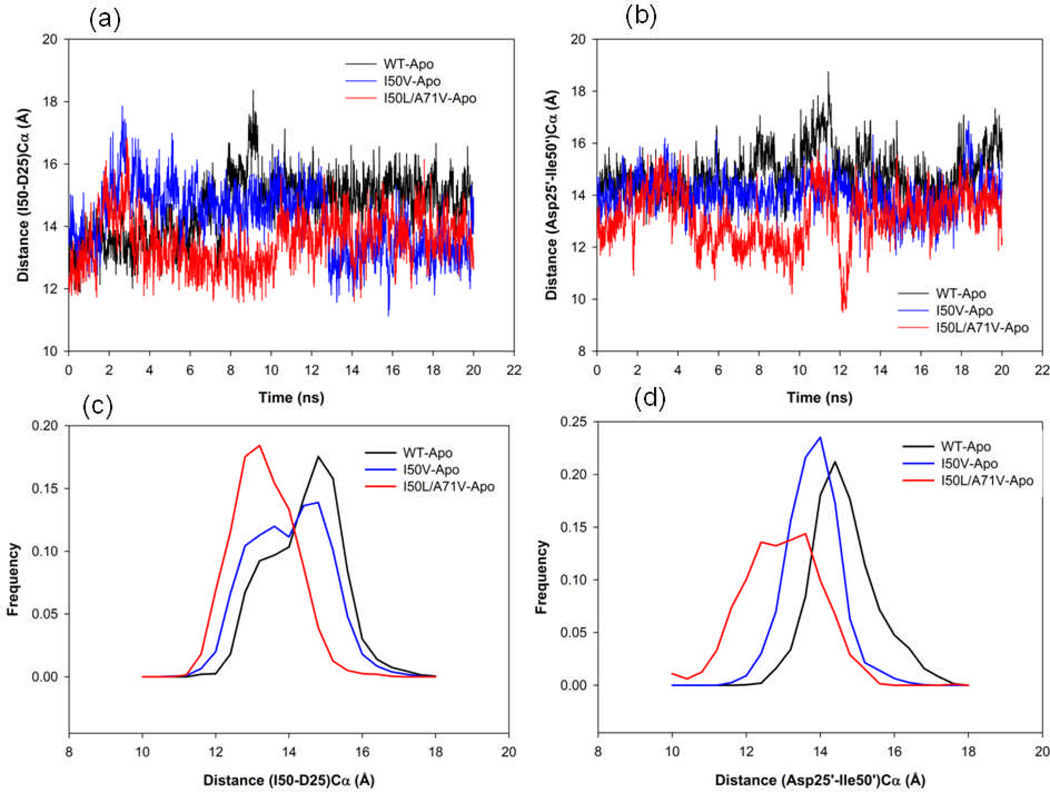
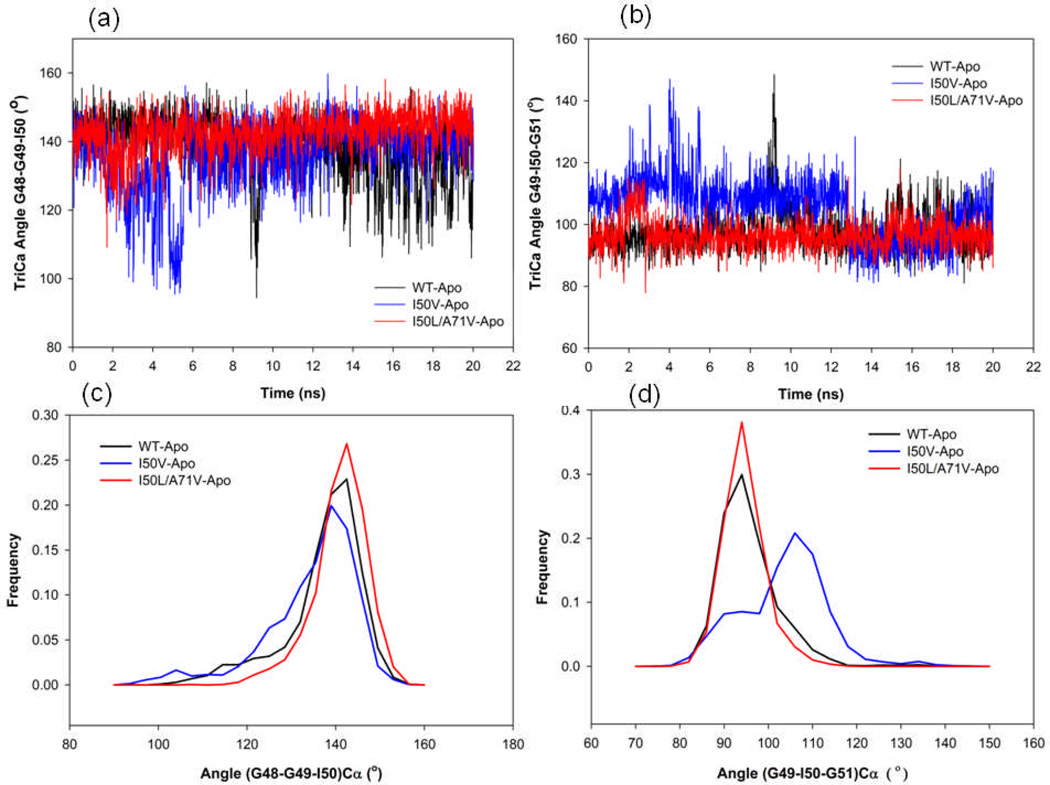
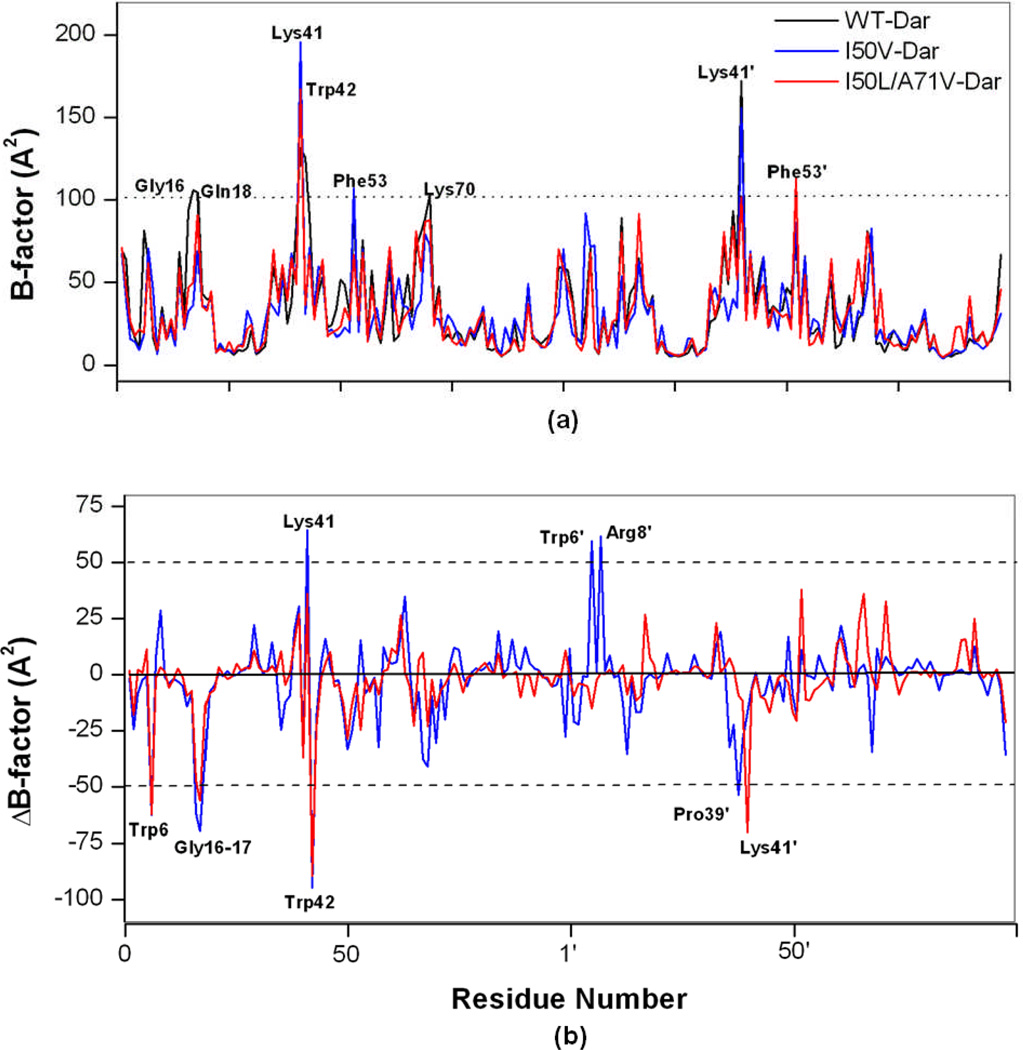
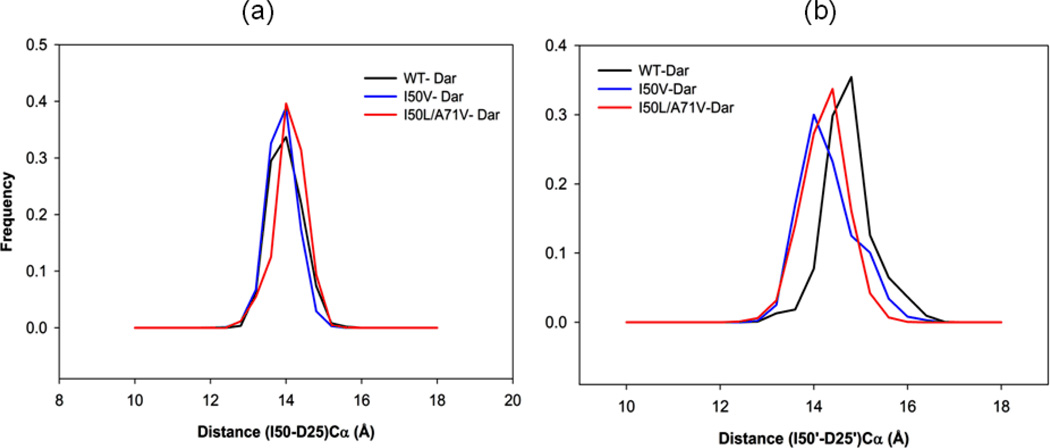
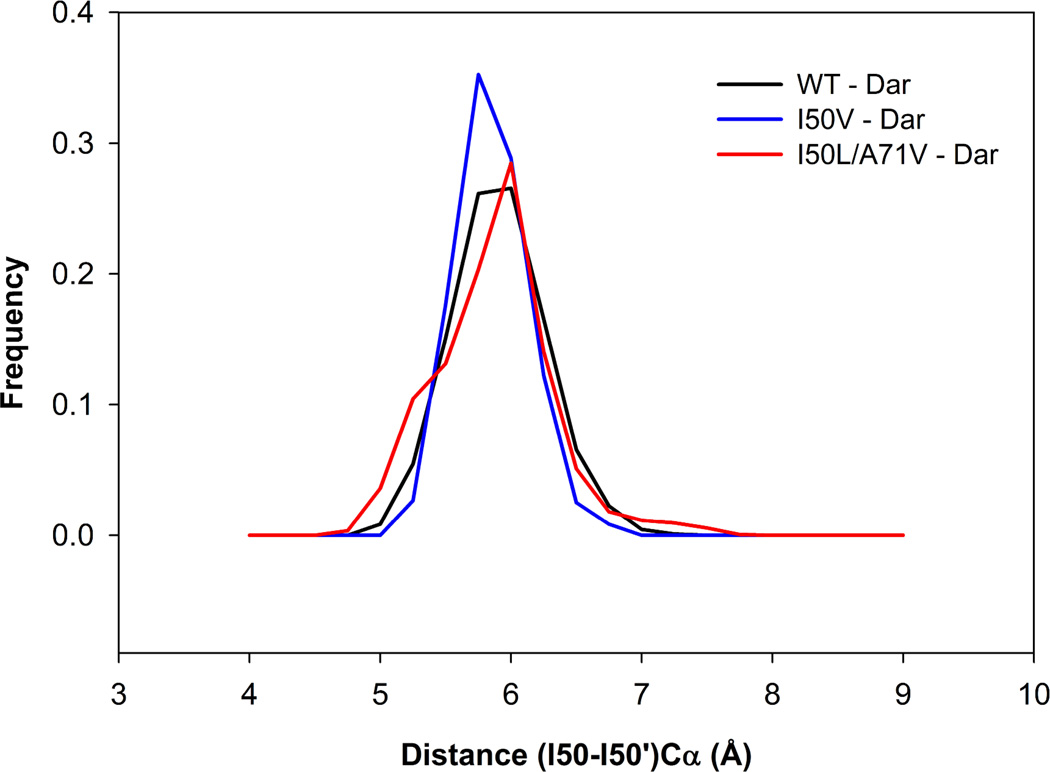
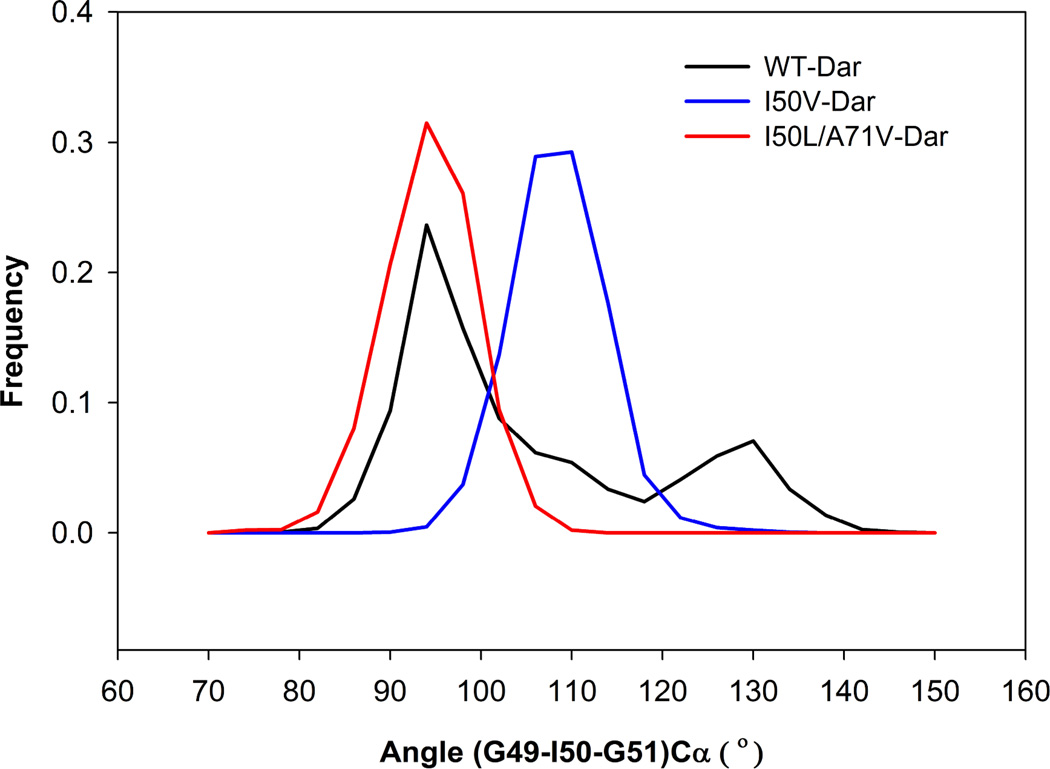
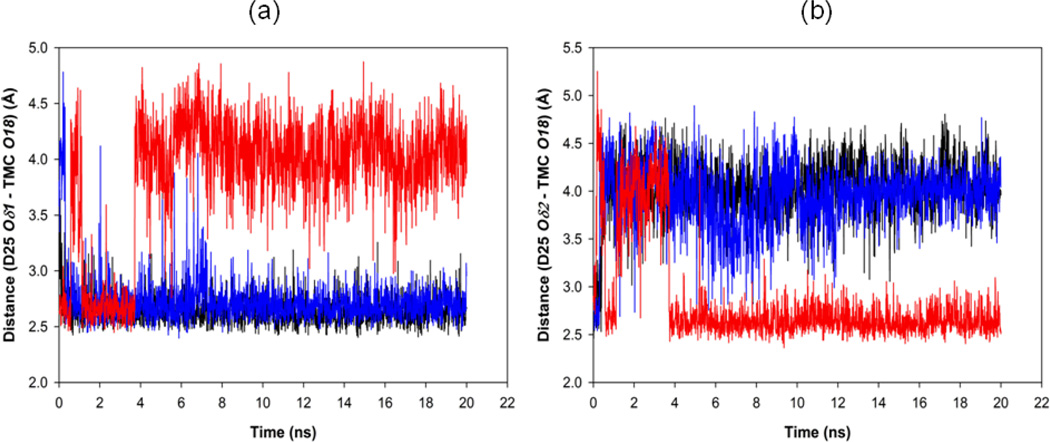
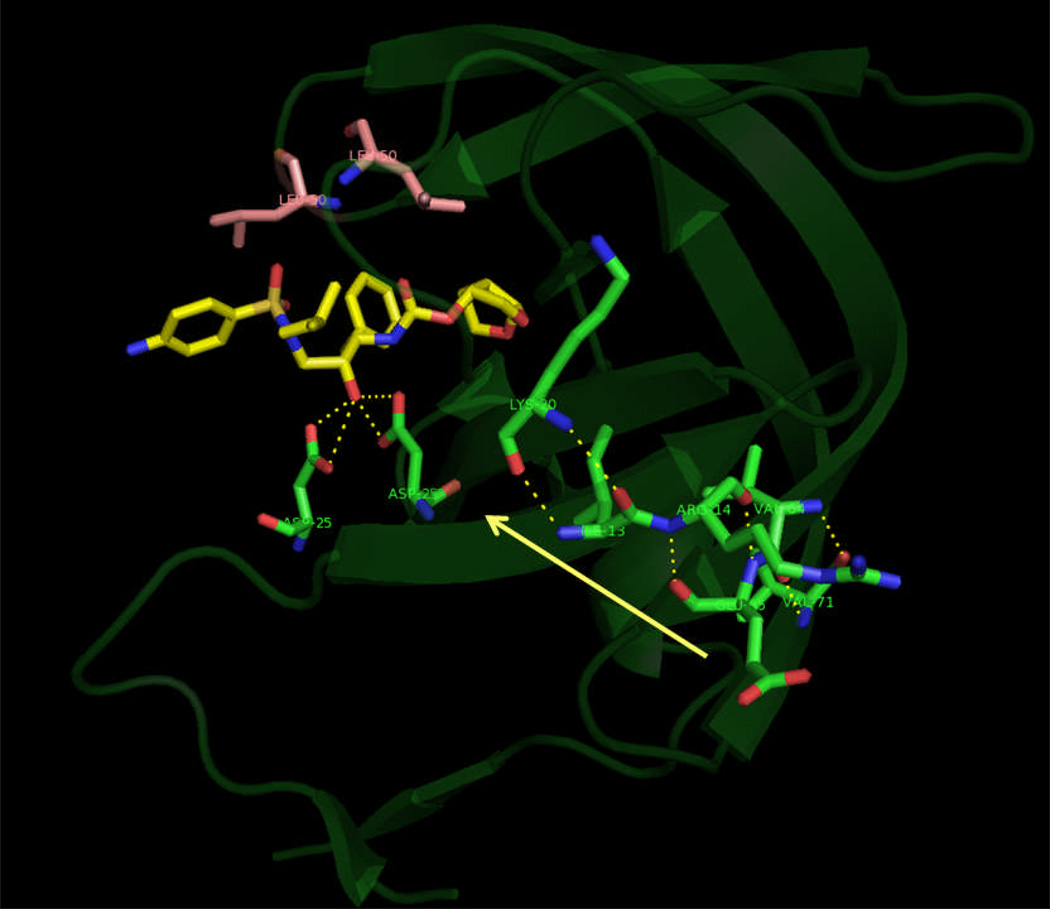
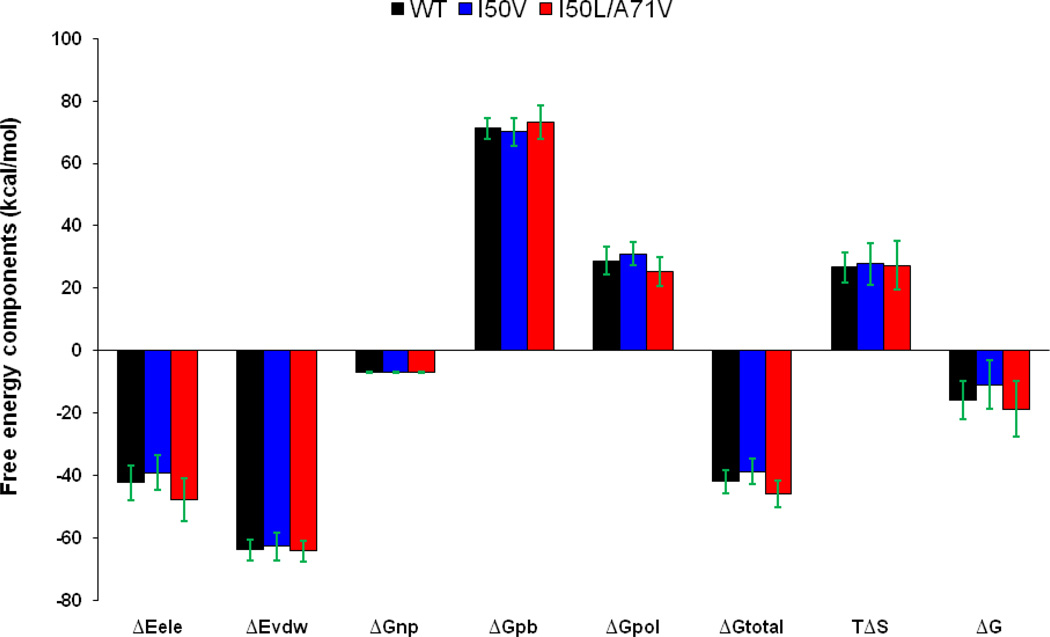
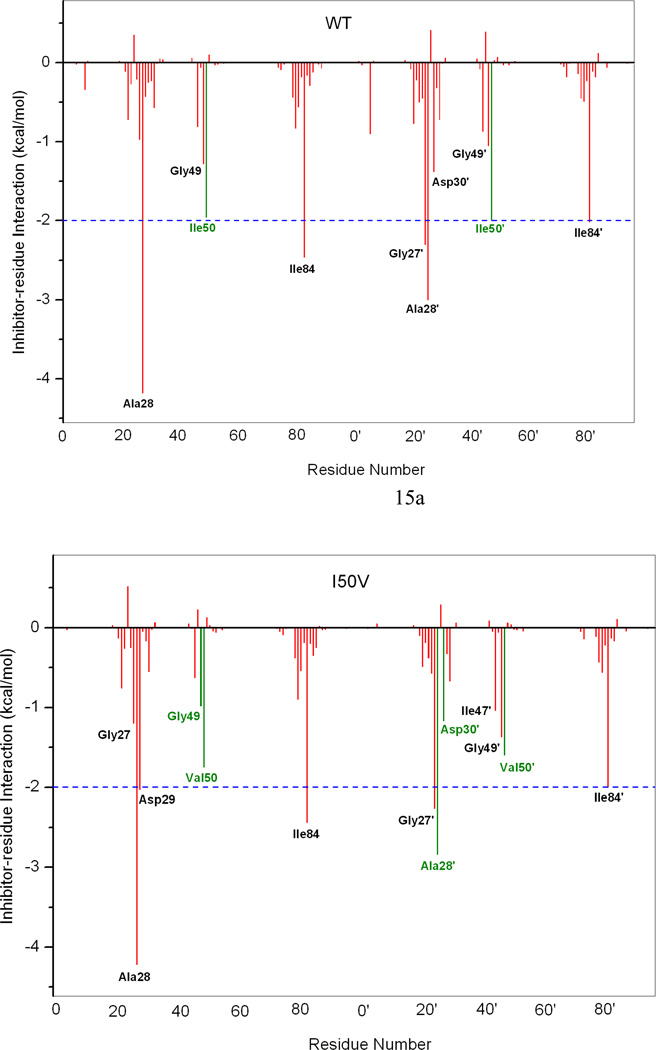
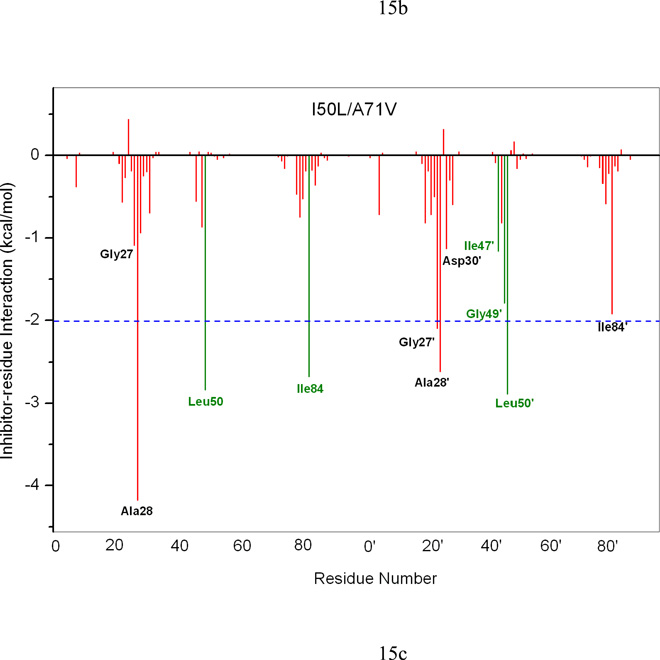
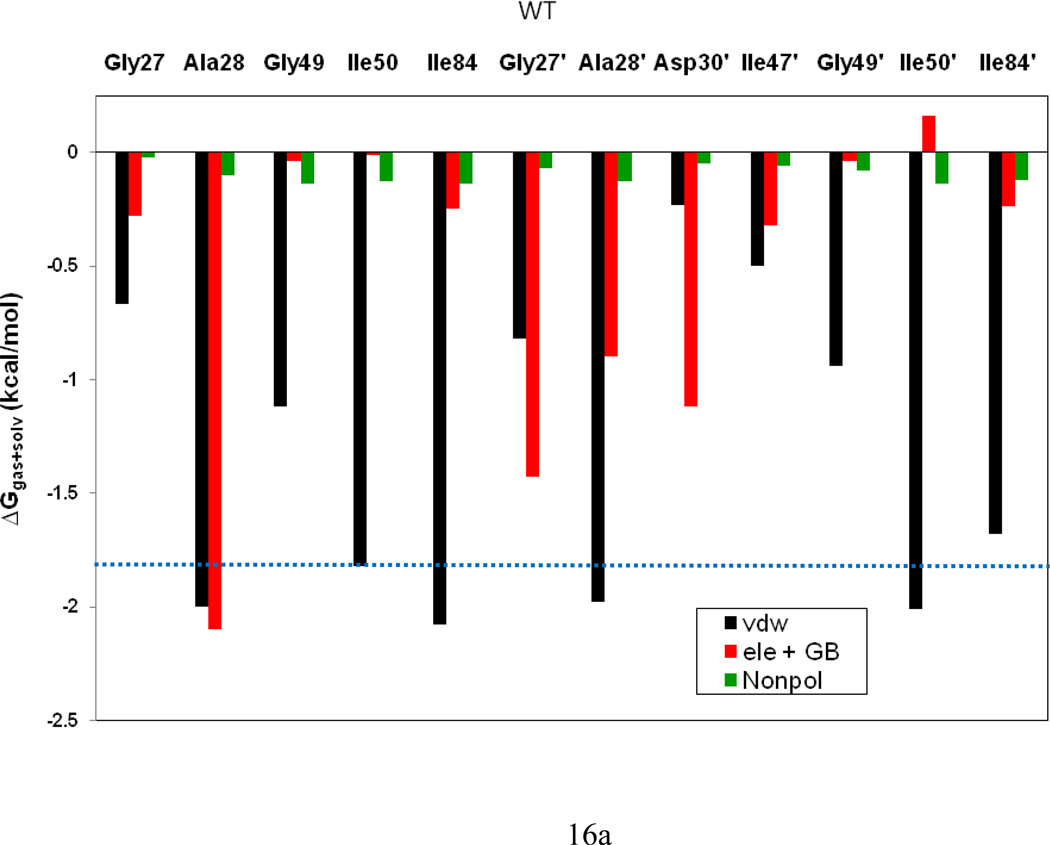
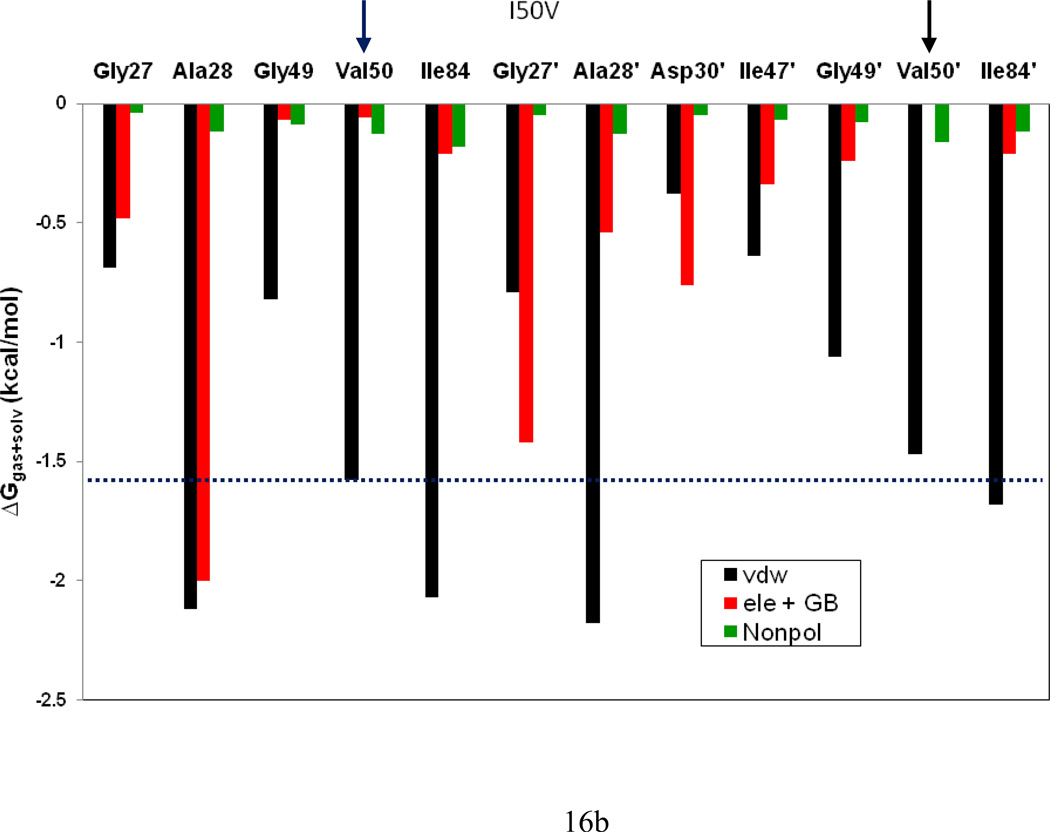
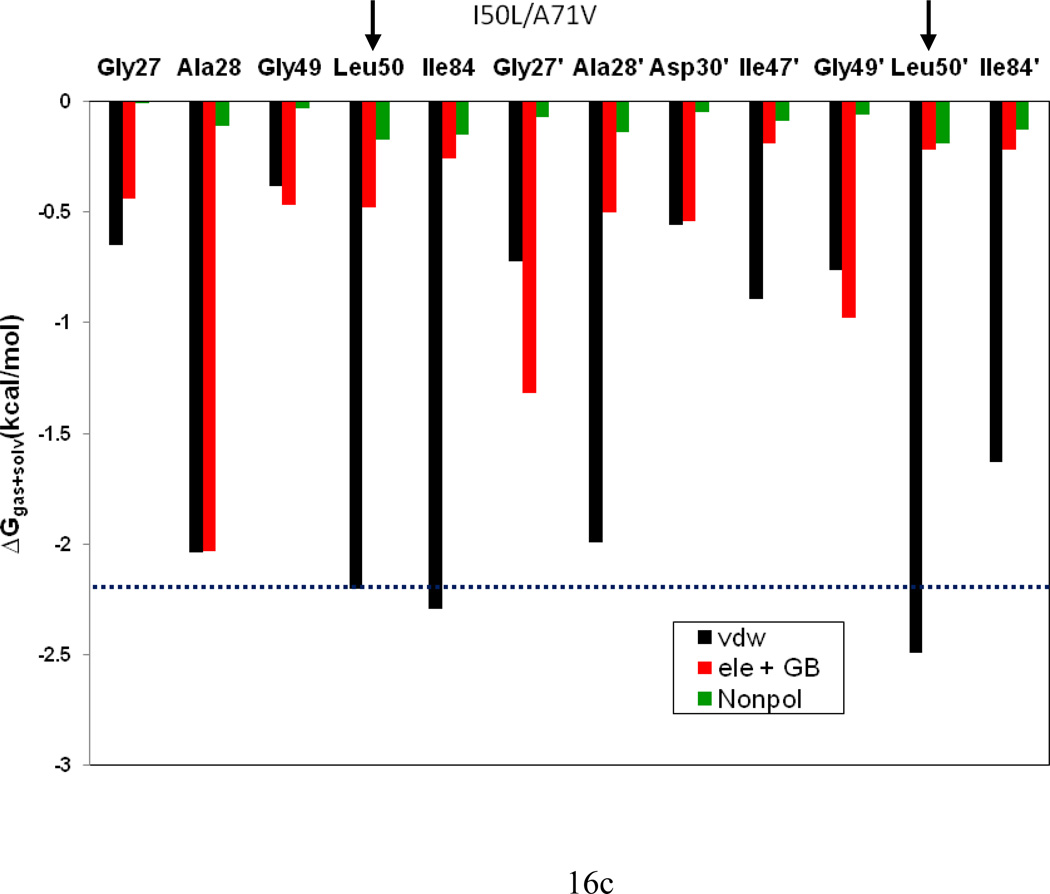
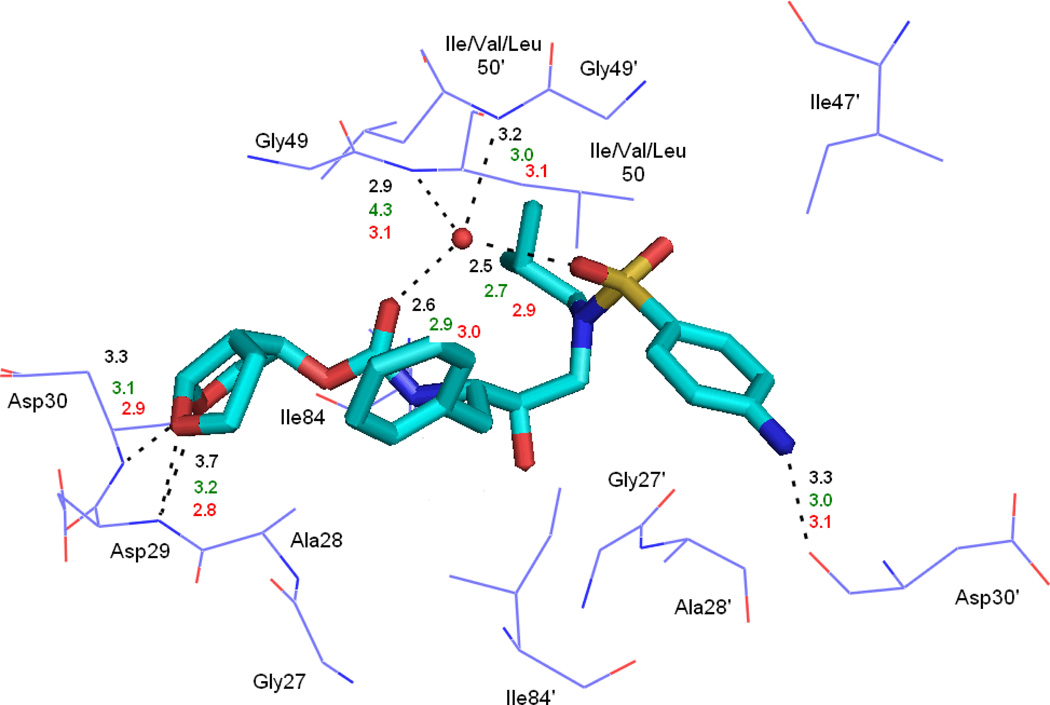
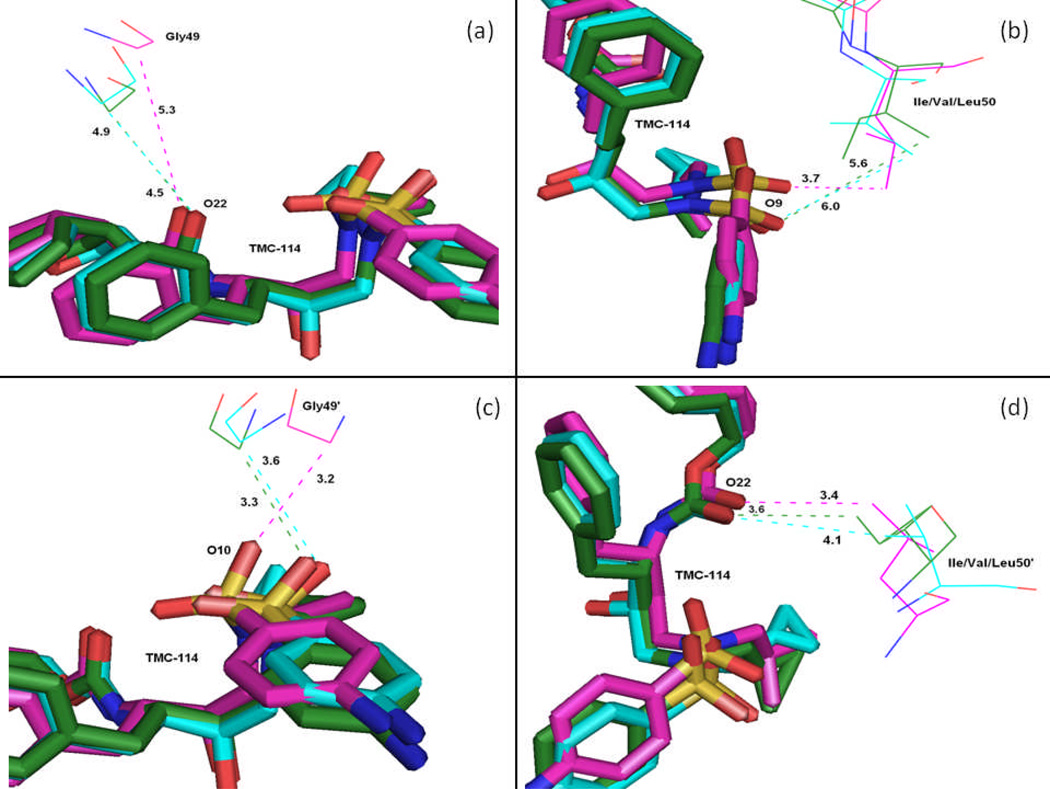
In the present work, the binding of inhibitor TMC114 (darunavir) to wild-type (WT), single (I50V) as well as double (I50L/A71V) mutant HIV-proteases (HIV-pr) was investigated with all-atom molecular dynamics (MD) simulations as well as molecular mechanic-Poisson-Boltzmann surface area (MM-PBSA) calculation. For both the apo and complexed HIV-pr, many intriguing effects due to double mutant, I50L/A71V, are observed. For example, the flap-flap distance and the distance from the active site to the flap residues in the apo I50L/A71V-HIV-pr are smaller than those of WT- and I50V-HIV-pr, probably making the active site smaller in volume and closer movement of flaps. For the complexed HIV-pr with TMC114, the double mutant I50L/A71V shows a less curling of the flap tips and less flexibility than WT and the single mutant I50V. As for the other previous studies, the present results also show that the single mutant I50V decreases the binding affinity of I50V-HIV-pr to TMC, resulting in a drug resistance; whereas the double mutant I50L/A71V increases the binding affinity, and as a result of the stronger binding, the I50L/A71V may be well adapted by the TMC114. The energy decomposition analysis suggests that the increase of the binding for the double mutant I50L/A71V-HIV-pr can be mainly attributed to the increase in electrostatic energy by -5.52 kacl/mol and van der Waals by -0.42 kcal/mol, which are canceled out in part by the increase of polar solvation energy of 1.99 kcal/mol. The I50L/A71V mutant directly increases the binding affinity by approximately -0.88 (Ile50 to Leu50) and -0.90 (Ile50' to Leu50') kcal/mol, accounting 45% for the total gain of the binding affinity. Besides the direct effects from the residues Leu50 and Leu50', the residue Gly49' increases the binding affinity of I50L/A71V-HIV-pr to the inhibitor by -0.74 kcal/mol, to which the electrostatic interaction of Leu50's backbone contributes by -1.23 kcal/mol. Another two residues Ile84 and Ile47' also increase the binding affinity by -0.22 and -0.29 kcal/mol, respectively, which can be mainly attributed to van der Waals terms (ΔT(vdw) = -0.21 and -0.39 kcal/mol).


Figures

Figure 1
Figure 1
Structure of HIV-pr complexed with TMC114. The HIV-pr is shown in magenta and cyan ribbons for chain-A and chain-B, respectively. Catalytic residues (Asp25 and Asp25’), and the sites of mutation are indicated by ball and stick representation for Ile50 and Ala71. TMC114 is bound in the active site and is labeled. Important regions of the HIV-pr like flap, flap elbow, fulcrum and cantilever are also shown.
Figure 2
Figure 2
Molecular structure of the inhibitor TMC114. The moiety bis-THF is labeled with a square bracket in color green. Important atoms like O9, O10, O18 and O22 which are involved in the interactions between the inhibitor and protein are also labeled in black bold letters.
Figure 3
Figure 3
Root-mean-square-displacement (RMSD) plot for backbone Cα atoms relative to their initial minimized complex structures as a function of time.
Figure 4
Figure 4
(a) B-factor of backbone atoms versus residue number of the WT, I50V and I50L/A71V HIV-pr apo structures and (b) Difference of B-factor values from molecular dynamics (MD) simulation for WT and mutant HIV-pr simulation of the apo protein (mutant B-factor – WT B-factor). The residues with absolute difference larger than 50 Å2 are labeled by two cutoff dashed lines.
Figure 5
Figure 5
Histogram distributions of Ile50–Ile50’ distance for WT, I50V mutant and I50L/A71V double mutant HIV-pr simulation of the apo protein.
Figure 6
Figure 6
Variability of (a) the Ile50-Asp25 Cα distances, (b) the Ile50’-Asp25’ Cα distances of the apo WT, I50V mutant and I50L/A71V double mutant HIV-pr. (c) Histogram distributions of Ile50–Asp25 distance; and (d) histogram distributions of Ile50’ –Asp25’ distance for WT and all mutant HIV-pr simulation of the apo protein.
Figure 7
Figure 7
Variability of (a) the Gly48-Gly49-Ile50 TriCa angles, (b) the Gly49-Ile50- Gly51 TriCa angles of the apo WT, I50V mutant and I50L/A71V double mutant HIV-pr. (c) Histogram distributions of Gly48-Gly49-Ile50 TriCa angles; and (d) histogram distributions of Gly49-Ile50- Gly51 TriCa angles for WT and all mutant HIV-pr simulation of the apo protein.
Figure 8
Figure 8
(a) B-factor of backbone atoms versus residue number of the WT, I50V and I50L/A71V HIV-pr –TMC114 complexed structures and (b) Difference of B-factor values from molecular dynamics (MD) simulation for WT and mutant HIV-pr simulation of the complexed protein (mutant B-factor – WT B-factor). The residues with absolute difference larger than 50 Å2 are labeled by two cutoff dashed lines.
Figure 9
Figure 9
Histogram distributions of (a) Ile50–Asp25 distance and (b) Ile50’-Asp25’ distance for WT, I50V mutant and I50L/A71V double mutant HIV-pr simulation of the TMC114 complexed protein.
Figure 10
Figure 10
Histogram distributions of Ile50–Ile50’ distance for WT, I50V mutant and I50L/A71V double mutant HIV-pr simulation of the TMC114 complexed proteins.
Figure 11
Figure 11
Histogram distributions of TriCa angle for WT, I50V mutant and I50L/A71V double mutant HIV-pr simulation of the TMC114 complexed proteins.
Figure 12
Figure 12
Time-series plot for the (a) protein-inhibitor (Asp25 OD1-TMC O18) interaction and (b) protein-inhibitor (Asp25 OD2-TMC O18) interaction for WT (Black line), for I50V (Blue line) and for I50L/A71V (Red line).
Figure 13
Figure 13
Schematic view of H-bond propagation in the double mutant I50L/A71V and Asp25(25’)-TMC114 flip-flop interaction. Arrow shows the route of propagation.
Figure 14
Figure 14
Energy components (kcal/mol) for the binding of TMC114 to the WT, I50V and I50L/A71V: ΔEele: Electrostatic energy in the gas phase; ΔEvdw: van der Waals energy; ΔGnp: non-polar solvation energy; ΔGpb: polar solvation energy; ΔGpol: ΔEele + ΔGpb; TΔS: Total entropy contribution; ΔGtotal = ΔEele + ΔEvdw + ΔEint + ΔGpb; ΔG = ΔGtotal − TΔS. Error bars in green solid line indicates the difference.
Figure 15
Figure 15
Decomposition of ΔG on a per-residue basis for the protein-inhibitor complex: (a) WT, (b) I50V and (c) I50L/A71V.
Figure 15
Figure 15
Decomposition of ΔG on a per-residue basis for the protein-inhibitor complex: (a) WT, (b) I50V and (c) I50L/A71V.
Figure 16
Figure 16
Decomposition of ΔG on a per-residue basis into contributions from the van der Waals energy (vdw), the sum of electrostatic interactions and polar solvation energy (ele + GB) and non-polar solvation energy (np) for the residues of |ΔG| ≥ 1.0 kcal/mol: (a) WT, (b) I50V and (c) I50L/A71V complexes.
Figure 16
Figure 16
Decomposition of ΔG on a per-residue basis into contributions from the van der Waals energy (vdw), the sum of electrostatic interactions and polar solvation energy (ele + GB) and non-polar solvation energy (np) for the residues of |ΔG| ≥ 1.0 kcal/mol: (a) WT, (b) I50V and (c) I50L/A71V complexes.
Figure 17
Figure 17
Geometries of residues with major interactions to TMC114 are plotted. Hydrogen bonds are shown in dashed black line with distances ( black-WT; green-I50V; red-I50L/A71V). TMC114 is indicated in a stick representation, the oxygen of WAT301 is indicated by a red sphere model, and the residues are shown in a line representation.
Figure 18
Figure 18
C-H…O interactions between the TMC114 and the flap residues (Gly49, Gly49’, Ile/Val/Leu50, and Ile/Val/Leu50’). TMC114 in sticks is colored by the atom type, and residues are shown as lines (green-WT; blue-I50V; purple-I50L/A71V).

Similar articles

Cited by

References

    1. Wlodawer A, Vondrasek J. Annu Rev. Biophys. Biomol. Struct. 1998;27:249–284. - PubMed
    1. Wu TD, Schiffer CA, Gonzales MJ, Taylor J, Kantor R, Chou S, Israelski D, Zolopa AR, Fessel WJ, Shafer RW. J. Virol. 2003;77:4836–4847. - PMC - PubMed
    1. Tie Y, Boross PI, Wang YF, Gaddis L, Hussain AK, Leshchenko S, Ghosh AK, Louis JM, Harrison RW, Weber IT. J. Mol. Biol. 2004;338:341–352. - PubMed
    1. Kovalevsky AY, Tie Y, Liu F, Boross PI, Wang YF, Leshchenko S, Ghosh AK, Harrison RW, Weber IT. J. Med. Chem. 2006;49:1379–1387. - PMC - PubMed
    1. Wang YF, Tie Y, Boross PI, Tozser J, Ghosh AK, Harrison RW, Weber IT. J. Med. Chem. 2007;50:4509–4515. - PMC - PubMed

Publication types