. 2012 Jan 12:13:8.
doi: 10.1186/1471-2105-13-8.

An integrative variant analysis suite for whole exome next-generation sequencing data

Affiliations

An integrative variant analysis suite for whole exome next-generation sequencing data

Danny Challis et al. BMC Bioinformatics. .

Abstract

Background: Whole exome capture sequencing allows researchers to cost-effectively sequence the coding regions of the genome. Although the exome capture sequencing methods have become routine and well established, there is currently a lack of tools specialized for variant calling in this type of data.

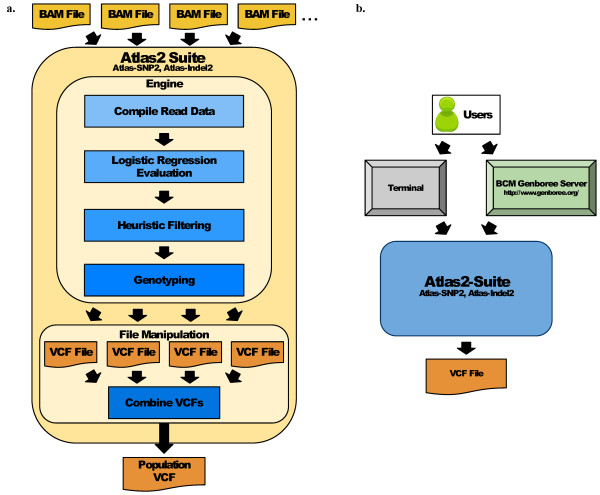
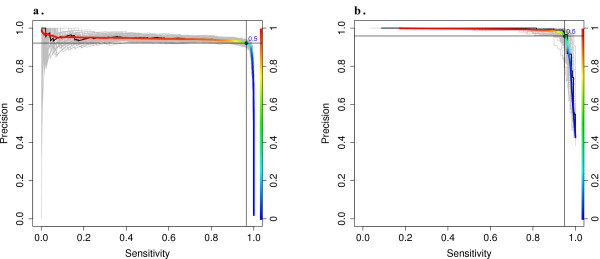
Results: Using statistical models trained on validated whole-exome capture sequencing data, the Atlas2 Suite is an integrative variant analysis pipeline optimized for variant discovery on all three of the widely used next generation sequencing platforms (SOLiD, Illumina, and Roche 454). The suite employs logistic regression models in conjunction with user-adjustable cutoffs to accurately separate true SNPs and INDELs from sequencing and mapping errors with high sensitivity (96.7%).

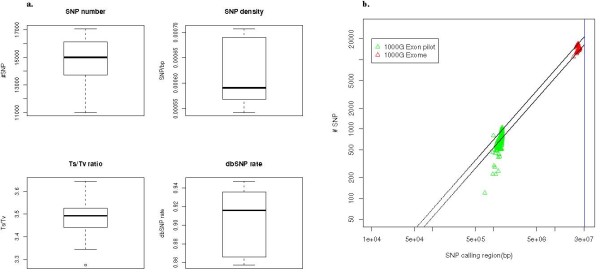
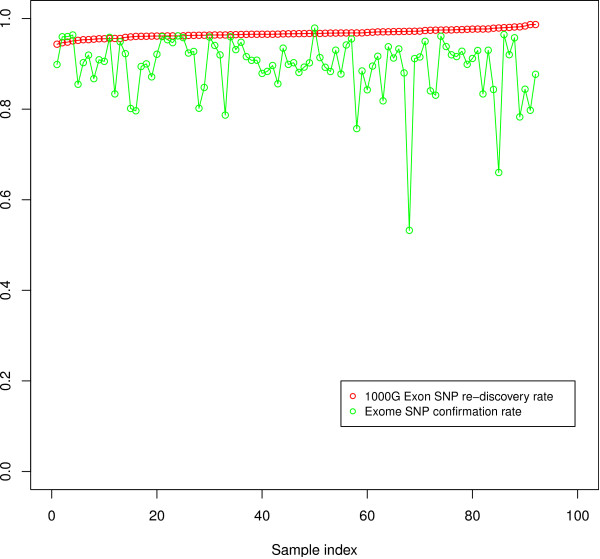
Conclusion: We have implemented the Atlas2 Suite and applied it to 92 whole exome samples from the 1000 Genomes Project. The Atlas2 Suite is available for download at http://sourceforge.net/projects/atlas2/. In addition to a command line version, the suite has been integrated into the Genboree Workbench, allowing biomedical scientists with minimal informatics expertise to remotely call, view, and further analyze variants through a simple web interface. The existing genomic databases displayed via the Genboree browser also streamline the process from variant discovery to functional genomics analysis, resulting in an off-the-shelf toolkit for the broader community.


Figures

Figure 1
Figure 1
The Atlas2 Suite Pipeline. (a) The Atlas2 Suite is designed to accept as input single sample BAM files which are individually processed by Atlas-SNP2 and/or Atlas-Indel2 to produce single sample variant calls in VCF format. Both Atlas-SNP2 and Atlas-Indel2 use the same basic algorithm: for each variant site all the read data is compiled, the compiled data is fed into a logistic regression model for evaluation, and variants that are of sufficiently high quality and pass the heuristic filters are then genotyped and output as a VCF file. For population analysis, multiple single-sample VCF files may be combined into a population-level VCF with any missing coverage information filled in. (b) The Atlas2 Suite is available for use in both a command line version and through the Baylor College of Medicine (BCM) Genboree Server.
Figure 2
Figure 2
Theoretical Performance of the Regression Models. (a) The Atlas-SNP2 model is evaluated on a subset of the training data, which requires a minimum total depth of 10 base-pairs. (b) The Atlas-Indel2 model is evaluated on a subset of the training data that requires at least 2 variant reads (a default heuristic filter). To estimate the effectiveness of the regression models and test for overfitting, a series of cross-validation tests were performed by repeatedly sampling half of the training data to be used to train the model, and then evaluating the model on the remaining data. This process was repeated 100 times, with each result plotted as a gray line. The average of all these lines is plotted as a bold, color-coded line. The color indicates the p cutoff which returns the given performance at that point. The suite's default cutoff of 0.5 is marked. The actual model evaluated on the full set is plotted as a black line, but is mostly covered by the average line.
Figure 3
Figure 3
SNP Call Metrics. (a) SNP metrics of 92 1000 Genomes exome samples. The four figures are SNP number, Ts/Tv, dbSNP% and SNP density distributions respectively. SNPs were called and compared in the callable region with a variant read depth of at least 2. Previous studies have indicated that coding SNPs should have a Ts/Tv ratio of 3-4 [15]. (b) SNP density in the 1000 Genomes Exome Project vs. the Exon Pilot. The SNP density was calculated as the number of SNPs discovered in each sample normalized against their callable region. The maximum and minimum SNP density in the 1000 Genomes exome data are 0.70/Kbp and 0.54/Kbp respectively, which are presented as two slope lines in the figure.
Figure 4
Figure 4
Comparison of 92 1000 Genomes Exome samples to Exome Pilot Data. We made SNP calls using the Atlas2 Suite on 92 samples from 1000 Genomes Phase 1 Exome project, and compared the result to the most recent release from the 1000 Genomes Exon Pilot project. The Atlas2 re-discovery rate was calculated for each sample (red). The average re-discovery rate is 96.7%. An average 89.5% of the SNPs called by Atlas2 were confirmed in the Exon Pilot project (green). The exome SNPs called by Atlas2 but not called in 1 KG Exon pilot is either due to Exon pilot's limited sensitivity or false discovery in Atlas2.
Figure 5
Figure 5
Computational resources. Both Atlas-SNP2 (a.) and Atlas-Indel2 (b.) were tested on a series of BAM files to evaluate run time and maximum memory usage. The algorithm for both applications is designed so that runtime increases linearly with the number of reads analyzed, while memory usage is approximately constant, based on the size of the reference genome.

Similar articles

Cited by

References

    1. Albert TJ, Molla MN, Muzny DM, Nazareth L, Wheeler D, Song X, Richmond TA, Middle CM, Rodesch MJ, Packard CJ. et al.Direct selection of human genomic loci by microarray hybridization. Nat Methods. 2007;4(11):903–905. doi: 10.1038/nmeth1111. - DOI - PubMed
    1. Sunyaev S, Ramensky V, Koch I, Lathe W, Kondrashov AS, Bork P. Prediction of deleterious human alleles. Hum Mol Genet. 2001;10(6):591–597. doi: 10.1093/hmg/10.6.591. - DOI - PubMed
    1. Adzhubei IA, Schmidt S, Peshkin L, Ramensky VE, Gerasimova A, Bork P, Kondrashov AS, Sunyaev SR. A method and server for predicting damaging missense mutations. Nat Methods. 2010;7(4):248–249. doi: 10.1038/nmeth0410-248. - DOI - PMC - PubMed
    1. Ng PC, Henikoff S. SIFT: Predicting amino acid changes that affect protein function. Nucleic Acids Res. 2003;31(13):3812–3814. doi: 10.1093/nar/gkg509. - DOI - PMC - PubMed
    1. Ng SB, Buckingham KJ, Lee C, Bigham AW, Tabor HK, Dent KM, Huff CD, Shannon PT, Jabs EW, Nickerson DA. et al.Exome sequencing identifies the cause of a mendelian disorder. Nat Genet. 2010;42(1):30–35. doi: 10.1038/ng.499. - DOI - PMC - PubMed

Publication types

LinkOut - more resources