

Review
doi: 10.1016/j.pmr.2011.11.004.
Epub 2011 Dec 14.
Use of skeletal muscle MRI in diagnosis and monitoring disease progression in Duchenne muscular dystrophy
Affiliations
- PMID: 22239869
- PMCID: PMC3561672
- DOI: 10.1016/j.pmr.2011.11.004
Item in Clipboard
Review
Use of skeletal muscle MRI in diagnosis and monitoring disease progression in Duchenne muscular dystrophy
Phys Med Rehabil Clin N Am.
2012 Feb.
Abstract
Studies have shown promise in using various approaches of magnetic resonance imaging (MRI) and magnetic resonance spectroscopy to evaluate skeletal muscle involvement in Duchenne muscular dystrophy. However, these studies have mainly been performed using a cross-sectional design, and the correlation of these MRI changes with disease progression and disease severity has not been fully elucidated. Overall, skeletal muscle MRI is a powerful and sensitive technique in the evaluation of muscle disease, and its use as a biomarker for disease progression or therapeutic response in clinical trials deserves further study.
Copyright © 2012. Published by Elsevier Inc.
Figures
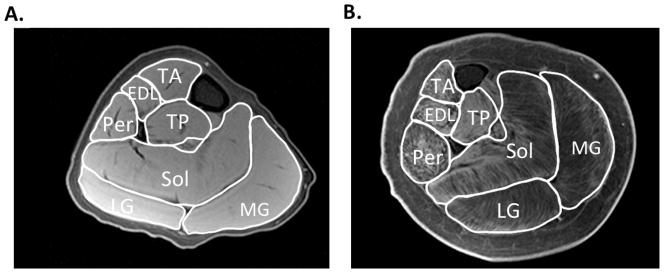
Representative T1-weighted fat suppressed images of the lower leg of a boy with DMD that appears to have relatively little involvement (A) and in a boy that the disease is more progressed (B). This MR sequence can be utilized to determine maximal cross sectional area in various lower leg muscles, including the tibialis anterior (TA), extensor digitorum longus (EDL), tibialis posterior (TP), peroneaus (Per), soleus (Sol), lateral gastrocnemius (LG), and medial gastrocnemius (MG).
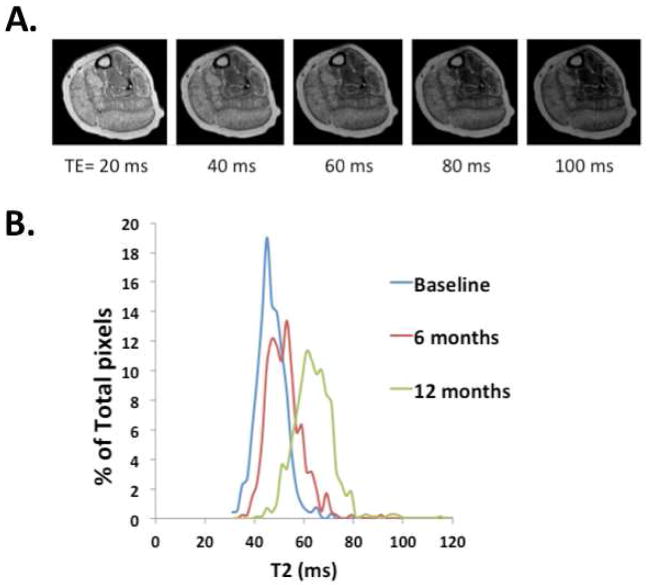
Representative T2-weighted images acquired with a TE of 20, 40, 60, 80, and 100 ms (A). Using these images A T2 map can be created, then the pixels plotted within a region of interest to create a histogram (B). Note, the rightward shift of the histogram indicating progression of disease in the soleus over a one year period in this subject.
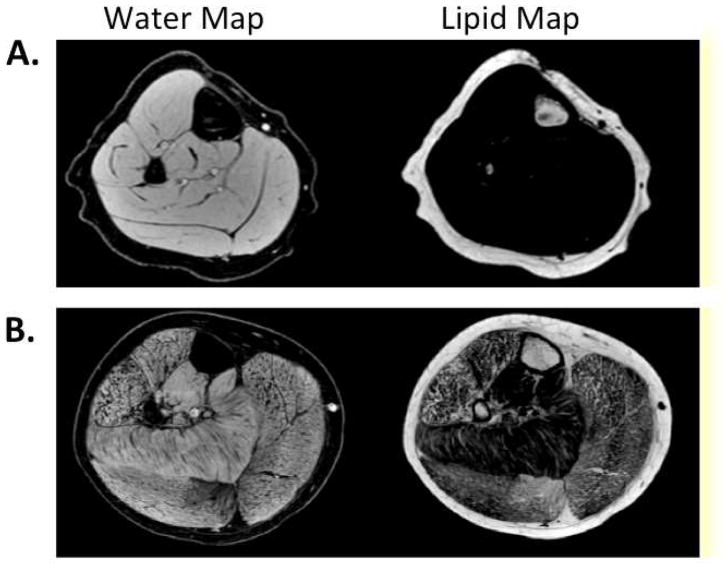
Example water and lipid maps of the lower leg of a control (A) and a boy with Duchenne muscular dystrophy (B) using 3pt Dixon.
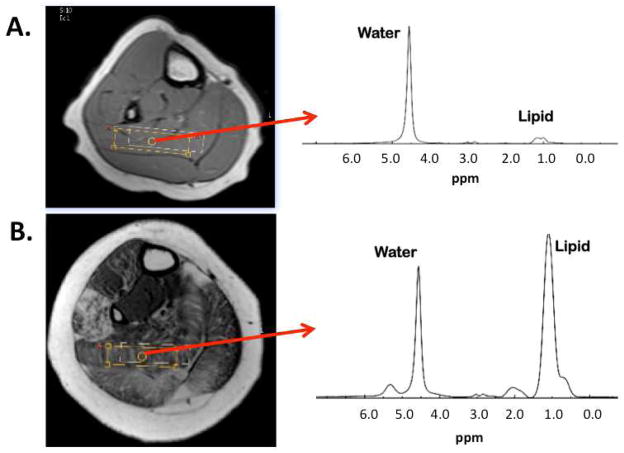
Example spectrum acquired from the soleus of a control (A) and a boy with Duchenne muscular dystrophy (B). Lipid peak includes a composite of intramyocellular (IMCL) and extramyocelluar (EMCL) lipid.
References
-
- Amthor H, Egelhof T, McKinnell I, Ladd ME, Janssen I, Weber J, et al. Albumin targeting of damaged muscle fibres in the mdx mouse can be monitored by MRI. Neuromuscular Disorders: NMD. 2004;14(12):791–796. - PubMed
-
- Angelini C. The role of corticosteroids in muscular dystrophy: A critical appraisal. Muscle & Nerve. 2007;36(4):424–435. - PubMed
-
- Dixon WT. Simple proton spectroscopic imaging. Radiology. 1984;153(1):189–194. - PubMed
-
- Dubowitz V. Muscle disorders in children. 2. UK: Kidlington; 1995.
Publication types
MeSH terms
Substances
Grants and funding
LinkOut - more resources
Full Text Sources
Other Literature Sources
Medical
