

Noninvasive LV pressure estimation using subharmonic emissions from microbubbles
- PMID: 22239898
- PMCID: PMC6054451
- DOI: 10.1016/j.jcmg.2011.08.017
Noninvasive LV pressure estimation using subharmonic emissions from microbubbles
Abstract
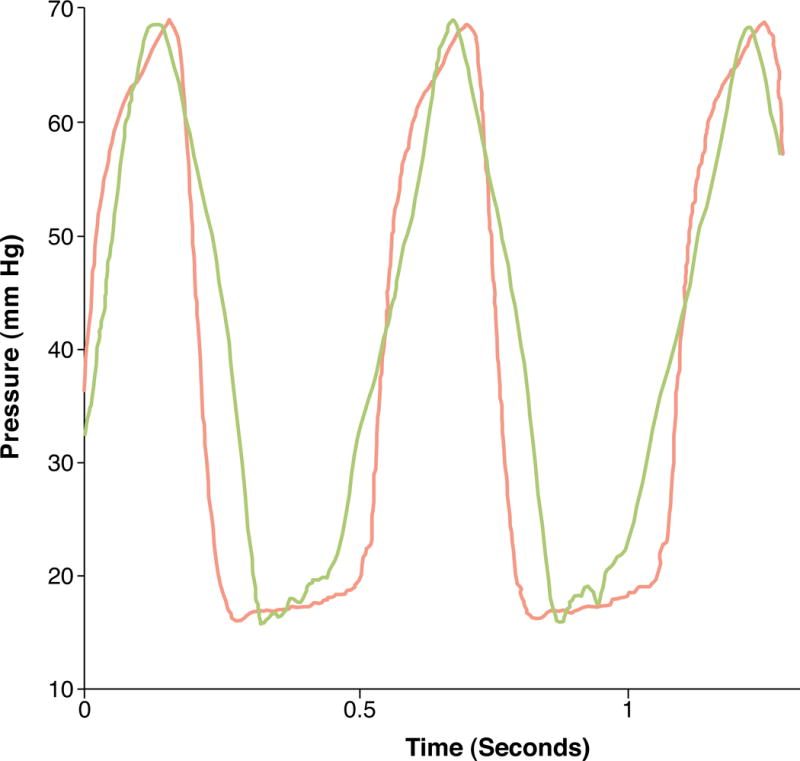
To develop a new noninvasive approach to quantify left ventricular (LV) pressures using subharmonic emissions from microbubbles, an ultrasound scanner was used in pulse inversion grayscale mode; unprocessed radiofrequency data were obtained with pulsed wave Doppler from the aorta and/or LV during Sonazoid infusion. Subharmonic data (in dB) were extracted and processed. Calibration factor (mm Hg/dB) from the aortic pressure was used to estimate LV pressures. Errors ranged from 0.19 to 2.50 mm Hg when estimating pressures using the aortic calibration factor, and were higher (0.64 to 8.98 mm Hg) using a mean aortic calibration factor. Subharmonic emissions from ultrasound contrast agents have the potential to noninvasively monitor LV pressures.
Copyright © 2012 American College of Cardiology Foundation. Published by Elsevier Inc. All rights reserved.
Figures


Similar articles
-
Evaluation of Intracardiac Pressures Using Subharmonic-aided Pressure Estimation with Sonazoid Microbubbles.Radiol Cardiothorac Imaging. 2024 Feb;6(1):e230153. doi: 10.1148/ryct.230153. Radiol Cardiothorac Imaging. 2024. PMID: 38358329 Free PMC article. Clinical Trial.
-
Subharmonic microbubble emissions for noninvasively tracking right ventricular pressures.Am J Physiol Heart Circ Physiol. 2012 Jul;303(1):H126-32. doi: 10.1152/ajpheart.00560.2011. Epub 2012 May 4. Am J Physiol Heart Circ Physiol. 2012. PMID: 22561300 Free PMC article.
-
Noninvasive estimation of dynamic pressures in vitro and in vivo using the subharmonic response from microbubbles.IEEE Trans Ultrason Ferroelectr Freq Control. 2011 Oct;58(10):2056-66. doi: 10.1109/TUFFC.2011.2056. IEEE Trans Ultrason Ferroelectr Freq Control. 2011. PMID: 21989870
-
Preliminary experience with NC100100, a new ultrasound contrast agent for intravenous injection.Eur Radiol. 1999;9 Suppl 3:S343-6. doi: 10.1007/pl00014070. Eur Radiol. 1999. PMID: 10602925 Review. No abstract available.
-
Italian Society of Cardiovascular Echography (SIEC) Consensus Conference on the state of the art of contrast echocardiography.Ital Heart J. 2004 Apr;5(4):309-34. Ital Heart J. 2004. PMID: 15185894 Review.
Cited by
-
Evaluation of Intracardiac Pressures Using Subharmonic-aided Pressure Estimation with Sonazoid Microbubbles.Radiol Cardiothorac Imaging. 2024 Feb;6(1):e230153. doi: 10.1148/ryct.230153. Radiol Cardiothorac Imaging. 2024. PMID: 38358329 Free PMC article. Clinical Trial.
-
Three-Dimensional Subharmonic Aided Pressure Estimation for Assessing Arterial Plaques in a Rabbit Model.J Ultrasound Med. 2019 Jul;38(7):1865-1873. doi: 10.1002/jum.14884. Epub 2018 Dec 17. J Ultrasound Med. 2019. PMID: 30560581 Free PMC article.
-
Subharmonic aided pressure estimation for monitoring interstitial fluid pressure in tumours--in vitro and in vivo proof of concept.Ultrasonics. 2014 Sep;54(7):1938-44. doi: 10.1016/j.ultras.2014.04.022. Epub 2014 May 6. Ultrasonics. 2014. PMID: 24856899 Free PMC article.
-
An Implementation of Patient-Specific Biventricular Mechanics Simulations With a Deep Learning and Computational Pipeline.Front Physiol. 2021 Sep 16;12:716597. doi: 10.3389/fphys.2021.716597. eCollection 2021. Front Physiol. 2021. PMID: 34603077 Free PMC article.
-
Noninvasive Estimation of Tumor Interstitial Fluid Pressure from Subharmonic Scattering of Ultrasound Contrast Microbubbles.Biosensors (Basel). 2023 May 8;13(5):528. doi: 10.3390/bios13050528. Biosensors (Basel). 2023. PMID: 37232888 Free PMC article.
References
-
- Chatterjee K. The Swan-Ganz catheters: past, present and future: a viewpoint. Circulation. 2009;119:147–52. - PubMed
-
- Solomon S, Stevenson L. Recalibrating the barometer: is it time to take a critical look at noninvasive approaches to measuring filling pressures? Circulation. 2009;119:13–5. - PubMed
-
- Shi W, Forsberg F, Raichlen J, Needleman L, Goldberg B. Pressure dependence of subharmonic signals from contrast microbubbles. Ultrasound Med Biol. 1999;25:275–83. - PubMed
-
- Forsberg F, Liu J, Shi W, Furuse J, Shimizu M, Goldberg B. In vivo pressure estimation using subharmonic contrast microbubble signals: proof of concept. IEEE Trans Ultrason, Ferroelec Freq Contr. 2005;52:581–3. - PubMed
Publication types
MeSH terms
Substances
Grants and funding
LinkOut - more resources
Full Text Sources
Other Literature Sources
Medical
Miscellaneous
