

Integrated proteomic, transcriptomic, and biological network analysis of breast carcinoma reveals molecular features of tumorigenesis and clinical relapse
- PMID: 22240506
- PMCID: PMC3433899
- DOI: 10.1074/mcp.M111.014910
Integrated proteomic, transcriptomic, and biological network analysis of breast carcinoma reveals molecular features of tumorigenesis and clinical relapse
Abstract
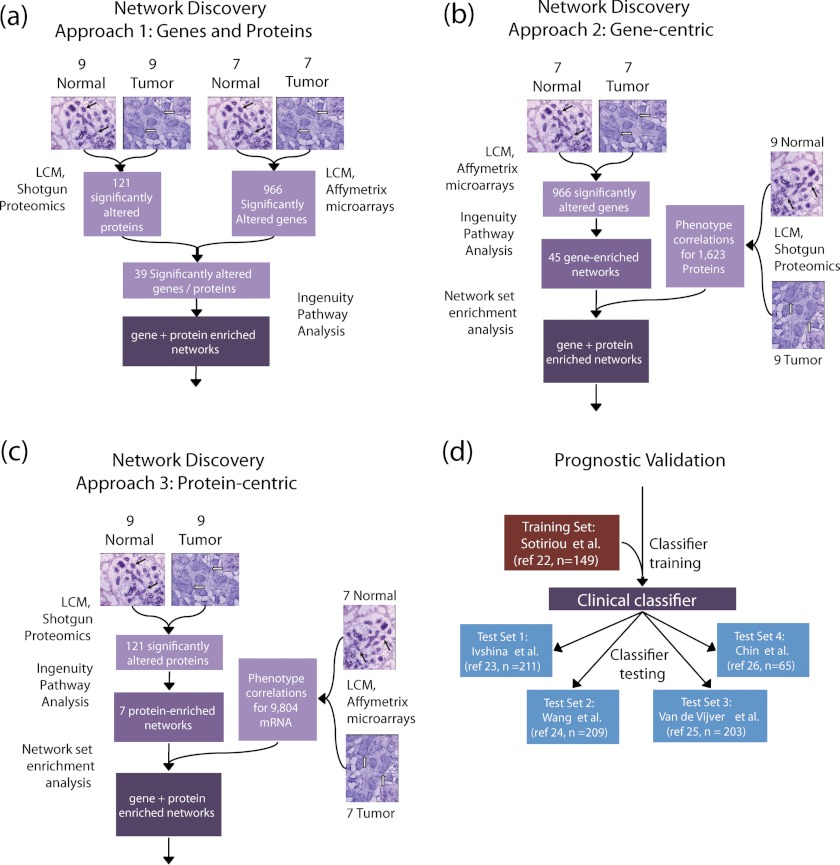
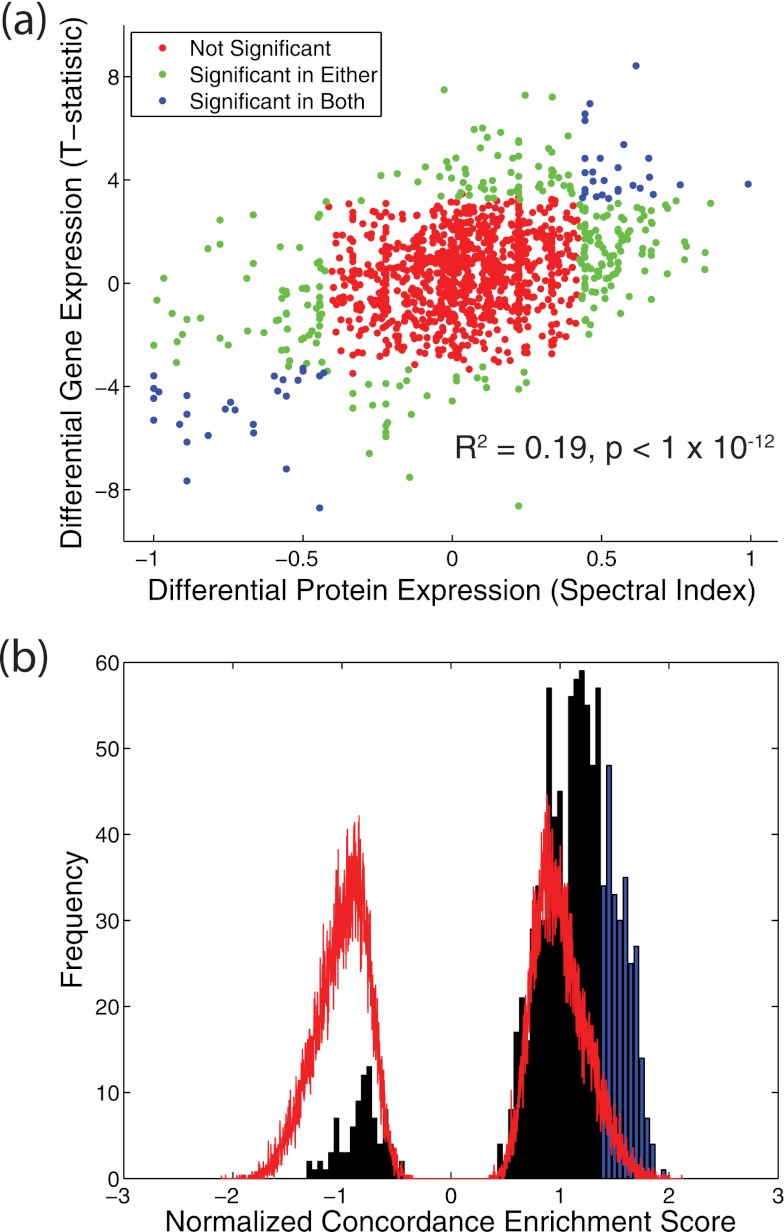
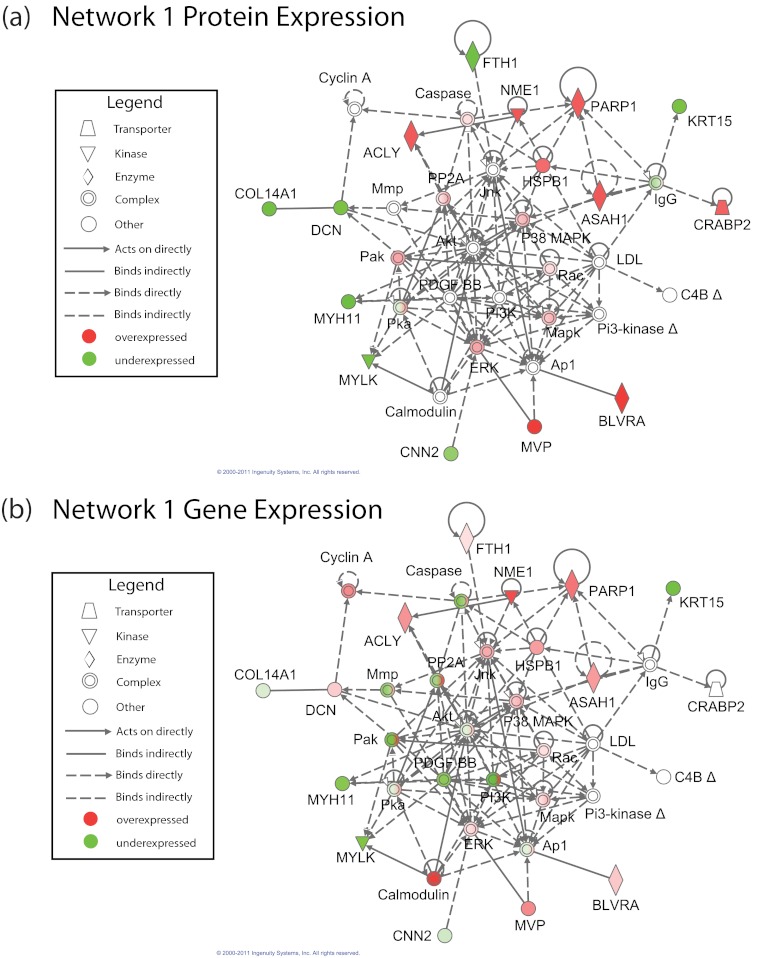
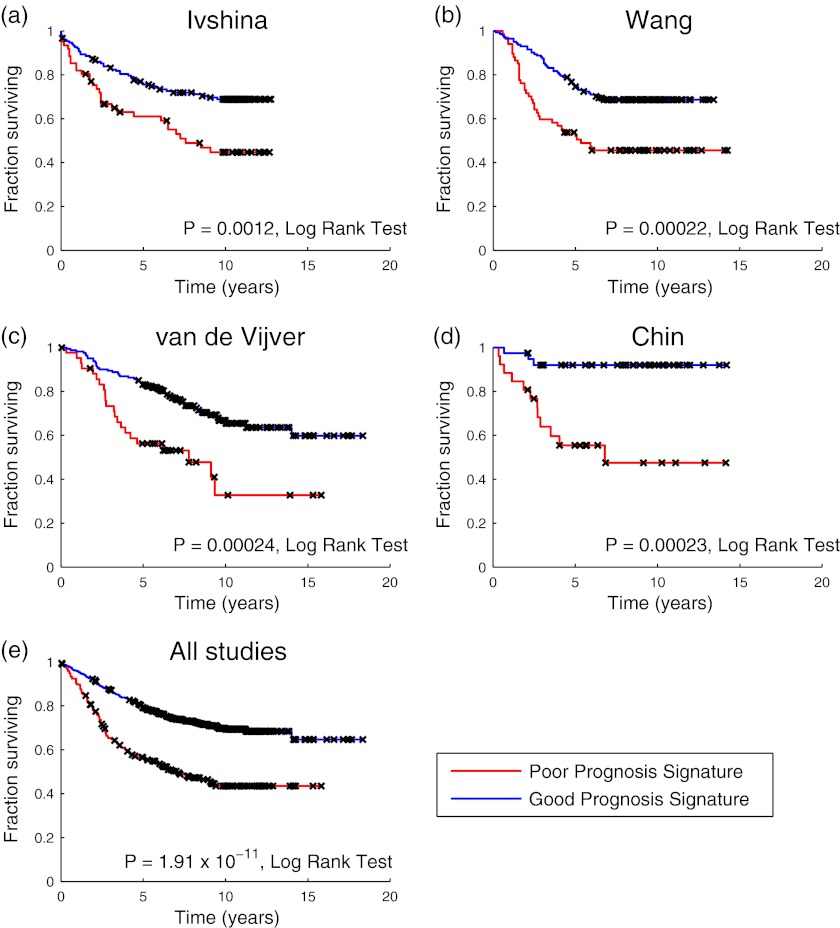
Gene and protein expression changes observed with tumorigenesis are often interpreted independently of each other and out of context of biological networks. To address these limitations, this study examined several approaches to integrate transcriptomic and proteomic data with known protein-protein and signaling interactions in estrogen receptor positive (ER+) breast cancer tumors. An approach that built networks from differentially expressed proteins and identified among them networks enriched in differentially expressed genes yielded the greatest success. This method identified a set of genes and proteins linking pathways of cellular stress response, cancer metabolism, and tumor microenvironment. The proposed network underscores several biologically intriguing events not previously studied in the context of ER+ breast cancer, including the overexpression of p38 mitogen-activated protein kinase and the overexpression of poly(ADP-ribose) polymerase 1. A gene-based expression signature biomarker built from this network was significantly predictive of clinical relapse in multiple independent cohorts of ER+ breast cancer patients, even after correcting for standard clinicopathological variables. The results of this study demonstrate the utility and power of an integrated quantitative proteomic, transcriptomic, and network analysis approach to discover robust and clinically meaningful molecular changes in tumors.
Figures
References
-
- Bièche I., Lidereau R. (2011) Genome-based and transcriptome-based molecular classification of breast cancer. Curr. Opin. Oncol. 23, 93–99 - PubMed
-
- Easton D. F., Pooley K. A., Dunning A. M., Pharoah P. D., Thompson D., Ballinger D. G., Struewing J. P., Morrison J., Field H., Luben R., Wareham N., Ahmed S., Healey C. S., Bowman R., Meyer K. B., Haiman C. A., Kolonel L. K., Henderson B. E., Le Marchand L., Brennan P., Sangrajrang S., Gaborieau V., Odefrey F., Shen C. Y., Wu P. E., Wang H. C., Eccles D., Evans D. G., Peto J., Fletcher O., Johnson N., Seal S., Stratton M. R., Rahman N., Chenevix-Trench G., Bojesen S. E., Nordestgaard B. G., Axelsson C. K., Garcia-Closas M., Brinton L., Chanock S., Lissowska J., Peplonska B., Nevanlinna H., Fagerholm R., Eerola H., Kang D., Yoo K. Y., Noh D. Y., Ahn S. H., Hunter D. J., Hankinson S. E., Cox D. G., Hall P., Wedren S., Liu J., Low Y. L., Bogdanova N., Schürmann P., Dörk T., Tollenaar R. A., Jacobi C. E., Devilee P., Klijn J. G., Sigurdson A. J., Doody M. M., Alexander B. H., Zhang J., Cox A., Brock I. W., MacPherson G., Reed M. W., Couch F. J., Goode E. L., Olson J. E., Meijers-Heijboer H., van den Ouweland A., Uitterlinden A., Rivadeneira F., Milne R. L., Ribas G., Gonzalez-Neira A., Benitez J., Hopper J. L., McCredie M., Southey M., Giles G. G., Schroen C., Justenhoven C., Brauch H., Hamann U., Ko Y. D., Spurdle A. B., Beesley J., Chen X., Mannermaa A., Kosma V. M., Kataja V., Hartikainen J., Day N. E., Cox D. R., Ponder B. A. (2007) Genome-wide association study identifies novel breast cancer susceptibility loci. Nature 447, 1087–1093 - PMC - PubMed
-
- Horlings H. M., Lai C., Nuyten D. S., Halfwerk H., Kristel P., van Beers E., Joosse S. A., Klijn C., Nederlof P. M., Reinders M. J., Wessels L. F., van de Vijver M. J. (2010) Integration of DNA copy number alterations and prognostic gene expression signatures in breast cancer patients. Clin. Cancer Res. 16, 651–663 - PubMed
Publication types
MeSH terms
Substances
Grants and funding
LinkOut - more resources
Full Text Sources
Other Literature Sources
Medical
