Functional transcriptional regulatory sequence (TRS) RNA binding and helix destabilizing determinants of murine hepatitis virus (MHV) nucleocapsid (N) protein
- PMID: 22241479
- PMCID: PMC3293523
- DOI: 10.1074/jbc.M111.287763
Functional transcriptional regulatory sequence (TRS) RNA binding and helix destabilizing determinants of murine hepatitis virus (MHV) nucleocapsid (N) protein
Abstract
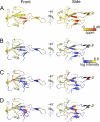
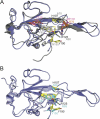
Coronavirus (CoV) nucleocapsid (N) protein contains two structurally independent RNA binding domains. These are denoted N-terminal domain (NTD) and C-terminal domain and are joined by a charged linker region rich in serine and arginine residues (SR linker). In mouse hepatitis virus (MHV), the NTD binds the transcriptional regulatory sequence (TRS) RNA, a conserved hexanucleotide sequence required for subgenomic RNA synthesis. The NTD is also capable of disrupting a short RNA duplex. We show here that three residues on the β3 (Arg-125 and Tyr-127) and β5 (Tyr-190) strands play key roles in TRS RNA binding and helix destabilization with Ala substitutions of these residues lethal to the virus. NMR studies of the MHV NTD·TRS complex revealed that this region defines a major RNA binding interface in MHV with site-directed spin labeling studies consistent with a model in which the adenosine-rich 3'-region of TRS is anchored by Arg-125, Tyr-127, and Tyr-190 in a way that is critical for efficient subgenomic RNA synthesis in MHV. Characterization of CoV N NTDs from infectious bronchitis virus and from severe acute respiratory syndrome CoV revealed that, although detailed NTD-TRS determinants are distinct from those of MHV NTD, rapid helix destabilization activity of CoV N NTDs is most strongly correlated with CoV function and virus viability.
Figures


Similar articles
-
Coronavirus N protein N-terminal domain (NTD) specifically binds the transcriptional regulatory sequence (TRS) and melts TRS-cTRS RNA duplexes.J Mol Biol. 2009 Dec 4;394(3):544-57. doi: 10.1016/j.jmb.2009.09.040. Epub 2009 Sep 24. J Mol Biol. 2009. PMID: 19782089 Free PMC article.
-
Solution structure of mouse hepatitis virus (MHV) nsp3a and determinants of the interaction with MHV nucleocapsid (N) protein.J Virol. 2013 Mar;87(6):3502-15. doi: 10.1128/JVI.03112-12. Epub 2013 Jan 9. J Virol. 2013. PMID: 23302895 Free PMC article.
-
Structures of the N- and C-terminal domains of MHV-A59 nucleocapsid protein corroborate a conserved RNA-protein binding mechanism in coronavirus.Protein Cell. 2010 Jul;1(7):688-97. doi: 10.1007/s13238-010-0079-x. Epub 2010 Jul 29. Protein Cell. 2010. PMID: 21203940 Free PMC article.
-
Recognition of the murine coronavirus genomic RNA packaging signal depends on the second RNA-binding domain of the nucleocapsid protein.J Virol. 2014 Apr;88(8):4451-65. doi: 10.1128/JVI.03866-13. Epub 2014 Feb 5. J Virol. 2014. PMID: 24501403 Free PMC article.
-
Amino acid residues critical for RNA-binding in the N-terminal domain of the nucleocapsid protein are essential determinants for the infectivity of coronavirus in cultured cells.Nucleic Acids Res. 2006;34(17):4816-25. doi: 10.1093/nar/gkl650. Epub 2006 Sep 13. Nucleic Acids Res. 2006. PMID: 16971454 Free PMC article.
Cited by
-
Structural dynamics of SARS-CoV-2 nucleocapsid protein induced by RNA binding.PLoS Comput Biol. 2022 May 12;18(5):e1010121. doi: 10.1371/journal.pcbi.1010121. eCollection 2022 May. PLoS Comput Biol. 2022. PMID: 35551296 Free PMC article.
-
Phosphoregulation of Phase Separation by the SARS-CoV-2 N Protein Suggests a Biophysical Basis for its Dual Functions.Mol Cell. 2020 Dec 17;80(6):1092-1103.e4. doi: 10.1016/j.molcel.2020.11.025. Epub 2020 Nov 20. Mol Cell. 2020. PMID: 33248025 Free PMC article.
-
Study of combining virtual screening and antiviral treatments of the Sars-CoV-2 (Covid-19).Microb Pathog. 2020 Sep;146:104241. doi: 10.1016/j.micpath.2020.104241. Epub 2020 May 5. Microb Pathog. 2020. PMID: 32387389 Free PMC article. Review.
-
Characterization of a critical interaction between the coronavirus nucleocapsid protein and nonstructural protein 3 of the viral replicase-transcriptase complex.J Virol. 2013 Aug;87(16):9159-72. doi: 10.1128/JVI.01275-13. Epub 2013 Jun 12. J Virol. 2013. PMID: 23760243 Free PMC article.
-
Structural basis for the participation of the SARS-CoV-2 nucleocapsid protein in the template switch mechanism and genomic RNA reorganization.J Biol Chem. 2024 Nov;300(11):107834. doi: 10.1016/j.jbc.2024.107834. Epub 2024 Sep 27. J Biol Chem. 2024. PMID: 39343000 Free PMC article. Review.
References
-
- Lai M. M. C., Perlman S., Anderson L. J. (2007) in Fields Virology (Fields B. N., Knipe D. M., Howley P. M., eds) 5th Ed., pp. 1305–1332, Lippincott Williams & Wilkins, Philadelphia
-
- Snijder E. J., Bredenbeek P. J., Dobbe J. C., Thiel V., Ziebuhr J., Poon L. L., Guan Y., Rozanov M., Spaan W. J., Gorbalenya A. E. (2003) Unique and conserved features of genome and proteome of SARS-coronavirus, an early split-off from the coronavirus group 2 lineage. J. Mol. Biol. 331, 991–1004 - PMC - PubMed
Publication types
MeSH terms
Substances
Grants and funding
LinkOut - more resources
Full Text Sources
Research Materials

