. 2012 May 1;302(9):G966-78.
doi: 10.1152/ajpgi.00380.2011. Epub 2012 Jan 12.

Colonic microbiome is altered in alcoholism

Affiliations

Colonic microbiome is altered in alcoholism

Ece A Mutlu et al. Am J Physiol Gastrointest Liver Physiol. .

Abstract

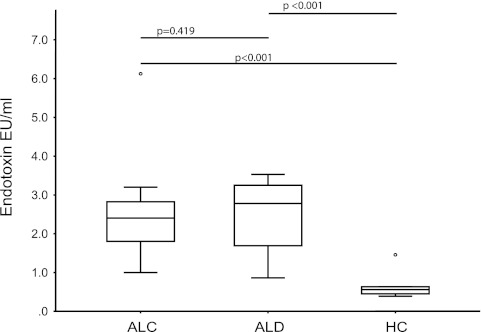
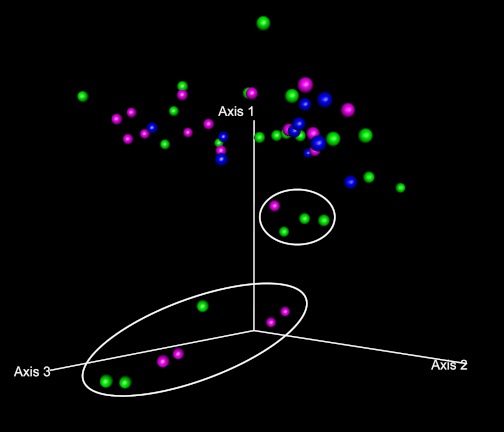
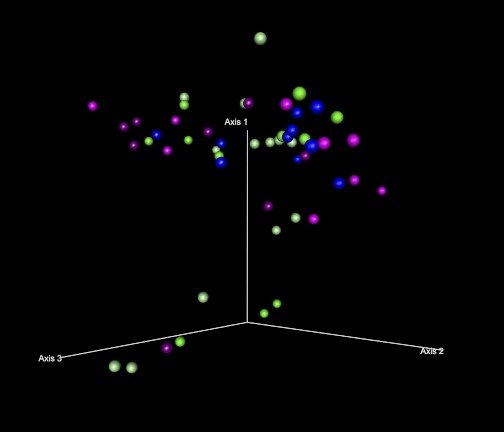
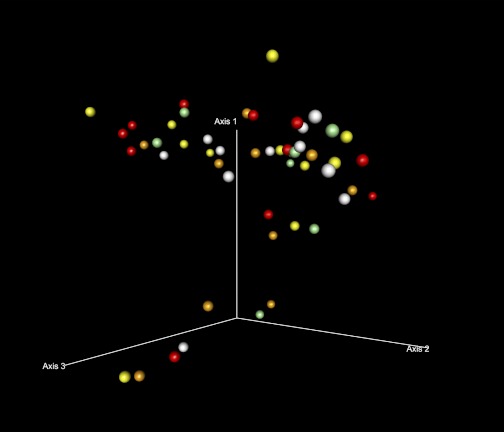
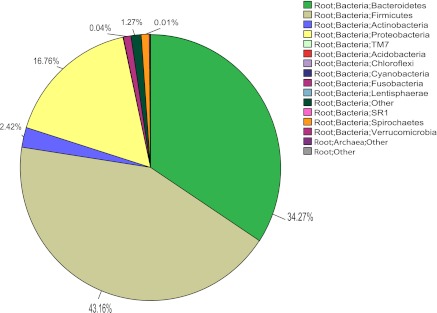
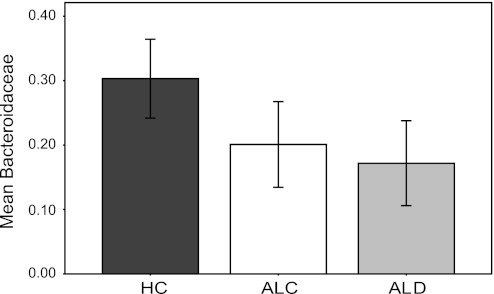
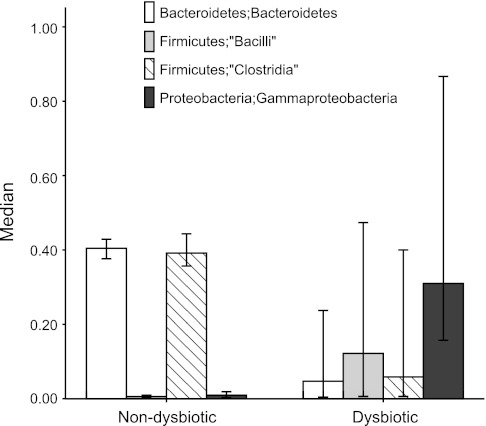
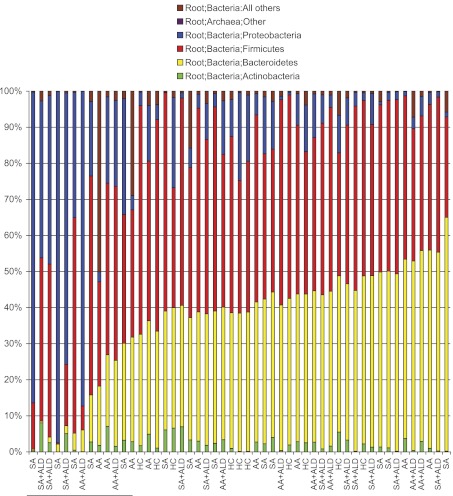
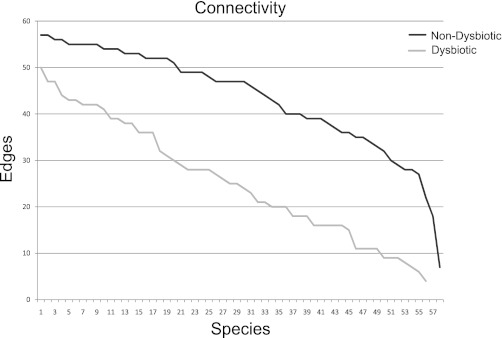
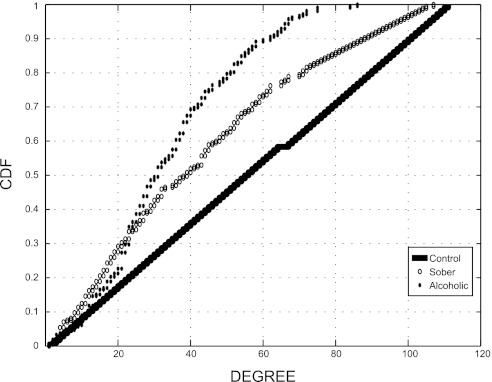
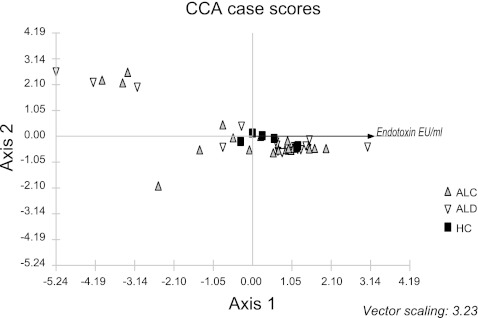
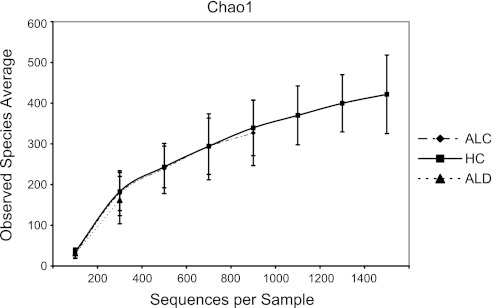
Several studies indicate the importance of colonic microbiota in metabolic and inflammatory disorders and importance of diet on microbiota composition. The effects of alcohol, one of the prominent components of diet, on colonic bacterial composition is largely unknown. Mounting evidence suggests that gut-derived bacterial endotoxins are cofactors for alcohol-induced tissue injury and organ failure like alcoholic liver disease (ALD) that only occur in a subset of alcoholics. We hypothesized that chronic alcohol consumption results in alterations of the gut microbiome in a subgroup of alcoholics, and this may be responsible for the observed inflammatory state and endotoxemia in alcoholics. Thus we interrogated the mucosa-associated colonic microbiome in 48 alcoholics with and without ALD as well as 18 healthy subjects. Colonic biopsy samples from subjects were analyzed for microbiota composition using length heterogeneity PCR fingerprinting and multitag pyrosequencing. A subgroup of alcoholics have an altered colonic microbiome (dysbiosis). The alcoholics with dysbiosis had lower median abundances of Bacteroidetes and higher ones of Proteobacteria. The observed alterations appear to correlate with high levels of serum endotoxin in a subset of the samples. Network topology analysis indicated that alcohol use is correlated with decreased connectivity of the microbial network, and this alteration is seen even after an extended period of sobriety. We show that the colonic mucosa-associated bacterial microbiome is altered in a subset of alcoholics. The altered microbiota composition is persistent and correlates with endotoxemia in a subgroup of alcoholics.


Figures

Fig. 1.
Fig. 1.
Endotoxin values by study group. Endotoxin values are in endotoxin units per milliliter. When the 3 study groups [healthy controls (HC) vs. alcoholics without liver disease (ALC) vs. alcoholics with liver disease (ALD)] are compared, endotoxin values were statistically significantly different (P = 0.001; Kruskal-Wallis). Results of post hoc comparisons are given as bars at top part of graph.
Fig. 2.
Fig. 2.
Principal coordinate analysis (PCO) plots of the length heterogeneity (LH)-PCR fingerprint abundance data in 3 dimensions. The axes represent the first highest discriminating axes using a Bray Curtis distance measure. HC are depicted as blue. ALC are depicted as green. ALD are depicted as magenta. Each dot corresponds to 1 case. Circles denote the 70% ellipsoid for each group.
Fig. 3.
Fig. 3.
Ordination by PCO plots of the taxa abundance at the class level in 3 dimensions. The axes represent the first 3 highest discriminating axes using a Bray Curtis distance measure. HC are depicted as blue. ALC are depicted as green. ALD are depicted as magenta. The core microbiome cluster is denoted by a manually inserted circle. Cases outside of the circle are classified as dysbiotic.
Fig. 4.
Fig. 4.
Ordination by weighted Unifrac distances by subject group. PCO plots of the subjects by subject group using weighted Unifrac distances are shown. The axes represent the first 3 highest discriminating axes. HC are depicted as blue. ALC are depicted as green. ALD are depicted as magenta. Circles represent 70% ellipsoids for each group.
Fig. 5.
Fig. 5.
Ordination by weighted Unifrac distances identifying dysbiotic cases. PCO plot by study group at a different angle denoting the dysbiotic cases is shown. HC are depicted as blue. ALC are depicted as green. ALD are depicted as magenta. Cases that lie away from the core HC group ellipsoid are given in 2 circles and denote the dysbiotic cases identified by weighted Unifrac analysis. Dysbiotic cases belong to both the ALC and ALD groups.
Fig. 6.
Fig. 6.
Ordination by weighted Unifrac distances by sobriety status. PCO plot of the subjects by sobriety status using weighted Unifrac distances is shown. HC are depicted as blue. ALC are depicted as green: sober alcoholics with ALC are depicted as light green and active alcoholics with ALC are depicted as dark green. ALD are depicted as magenta: sober alcoholics with ALD are depicted as light magenta and active alcoholics with ALD are depicted as dark magenta. The dysbiotic cases were not discriminated by sobriety status.
Fig. 7.
Fig. 7.
Ordination by weighted Unifrac distances by endotoxin quartile. PCO plot of the subjects by endotoxin quartile using weighted Unifrac distances is shown. Endotoxin quartile increases as colors get darker: white, light yellow, orange, and red represent 1st (lowest), 2nd, 3rd, and 4th (highest) endotoxin quartiles, respectively. The dysbiotic cases were not discriminated by endotoxin quartile. Cases in which endotoxin levels were not available were depicted in green.
Fig. 8.
Fig. 8.
Pie chart of multitag pyrosequencing data analyzed at the phylum level. Uncommon phyla that are a very small fraction of the total may not be visible in the chart even though they are present in the legend.
Fig. 9.
Fig. 9.
Bar graph of mean percent abundance of Bacteroidaceae at family level in the study groups ± 2 SE. Mean abundance of Bacteroidaceae was decreased in the alcoholic groups (P = 0.035; Kruskal-Wallis).
Fig. 10.
Fig. 10.
Bar graphs of the differences in major taxa at the class level in dysbiotic vs. nondysbiotic cases by all analysis methods. Eleven cases were found to be dysbiotic by all ordination methods employed in the study. Dysbiotic cases had lower percent mean abundances of Bacteroidetes (P = 0.016; Metastats) and Bacilli and Clostridia (P = 0.016 both; Metastats) and higher percent mean abundances of Gammaproteobacteria (P = 0.016; Metastats).
Fig. 11.
Fig. 11.
Rank order by abundance of the Bacteroidetes phylum. In the stacked histogram, the y axis shows the percent abundance of the 4 most abundant phyla for each study subject and the x axis labels show the group for the study subject. SA denotes a subject who was a sober alcoholic without liver disease; SA + ALD denotes a subject who was a sober alcoholic with liver disease; AA denotes a subject who was an active alcoholic without liver disease; AA + ALD denotes a subject who was an active alcoholic with liver disease. The abundance of the Bacteroidetes phylum in each subject was rank ordered and graphed in order of rising percent abundance. Bacteroidetes is denoted by the yellow portion of the bars for each subject. In this stacked histogram, the other most abundant taxa in each subject are color coded as follow: Actinobacteria phylum (green); Firmicutes phylum (red); Proteobacteria phylum (blue); Archea (pink); and all other sequences (brown). A rise in the Bacteroidetes phylum abundance is seen at about the 30% level. The 13 samples that had the lowest abundance in the Bacteroidetes phylum have been marked at the left lower corner of the graph.
Fig. 12.
Fig. 12.
Connectivity plot of dysbiotic and nondysbiotic groups from network analysis. Each taxa is represented as a node in complex graph, and an edge is made between 2 nodes if they are present in the same class and above a defined threshold. We then compared network topologies. We present the connectivity plot by node (taxa) for the 2 defined categories.
Fig. 13.
Fig. 13.
Cumulative distribution function (CDF) plot of subject classes from network analysis. Each taxa is represented as a node in complex graph, and a connection is made between 2 nodes if they are present in the same class and above a defined threshold. We then compared network topologies. We present the CDF of the degree distributions per node (taxa) for the 3 defined categories.
Fig. 14.
Fig. 14.
Canonical correspondence analysis (CCA) using endotoxin as the environmental variable and bacterial taxa at the class level. HC are depicted as black squares. ALC are depicted as gray upward triangles. ALD are depicted as open downward triangles.
Fig. 15.
Fig. 15.
Rarefaction curve using chao1 index by study group. Curves suggest no differences in α-diversity.

References

    1. Adachi Y, Moore LE, Bradford BU, Gao W, Thurman RG. Antibiotics prevent liver injury in rats following long-term exposure to ethanol. Gastroenterology 108: 218–224, 1995 - PubMed
    1. Ball SA, Tennen H, Poling JC, Kranzler HR, Rounsaville BJ. Personality, temperament, and character dimensions and the DSM-IV personality disorders in substance abusers. J Abnorm Psychol 106: 545–553, 1997 - PubMed
    1. Bigatello LM, Broitman SA, Fattori L, Di Paoli M, Pontello M, Bevilacqua G, Nespoli A. Endotoxemia, encephalopathy, and mortality in cirrhotic patients. Am J Gastroenterol 82: 11–15, 1987 - PubMed
    1. Binladen J, Gilbert MT, Bollback JP, Panitz F, Bendixen C, Nielsen R, Willerslev E. The use of coded PCR primers enables high-throughput sequencing of multiple homolog amplification products by 454 parallel sequencing. PloS One 2: e197, 2007 - PMC - PubMed
    1. Caporaso JG, Bittinger K, Bushman FD, DeSantis TZ, Andersen GL, Knight R. PyNAST: a flexible tool for aligning sequences to a template alignment. Bioinformatics (Oxford, England) 26: 266–267, 2010 - PMC - PubMed

Publication types