

Proof-of-concept study of monitoring cancer drug therapy with cerenkov luminescence imaging
- PMID: 22241909
- PMCID: PMC4143153
- DOI: 10.2967/jnumed.111.094623
Proof-of-concept study of monitoring cancer drug therapy with cerenkov luminescence imaging
Abstract
Cerenkov luminescence imaging (CLI) has emerged as a less expensive, easier-to-use, and higher-throughput alternative to other nuclear imaging modalities such as PET. It is expected that CLI will find many applications in biomedical research such as cancer detection, probe development, drug screening, and therapy monitoring. In this study, we explored the possibility of using CLI to monitor drug efficacy by comparisons against PET. To assess the performance of both modalities in therapy monitoring, 2 murine tumor models (large cell lung cancer cell line H460 and prostate cancer cell line PC3) were given bevacizumab versus vehicle treatments. Two common radiotracers, 3'-deoxy-3'-(18)F-fluorothymidine ((18)F-FLT) and (18)F-FDG, were used to monitor bevacizumab treatment efficacy.
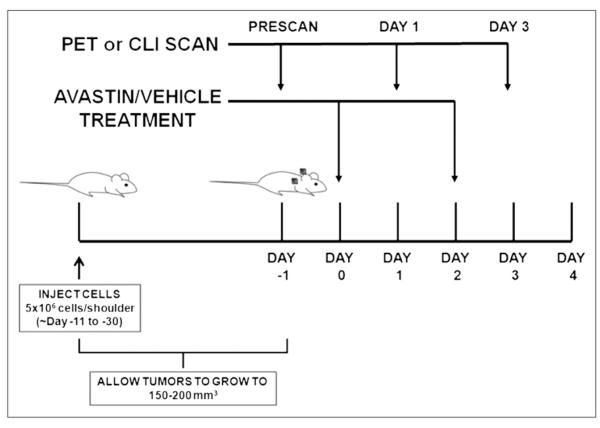
Methods: One group of mice (n = 6) was implanted with H460 xenografts bilaterally in the shoulder region, divided into treatment and control groups (n = 3 each), injected with (18)F-FLT, and imaged with PET immediately followed by CLI. The other group of mice (n = 6) was implanted with PC3 xenografts in the same locations, divided into treatment and control groups (n = 3 each), injected with (18)F-FDG, and imaged by the same modalities. Bevacizumab treatment was performed by 2 injections of 20 mg/kg at days 0 and 2.
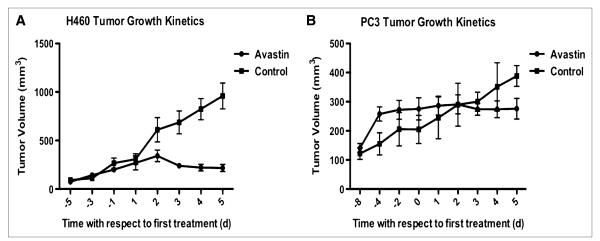
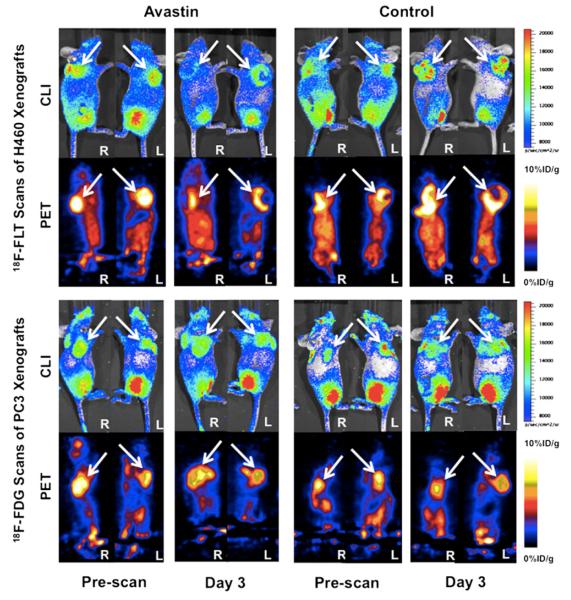
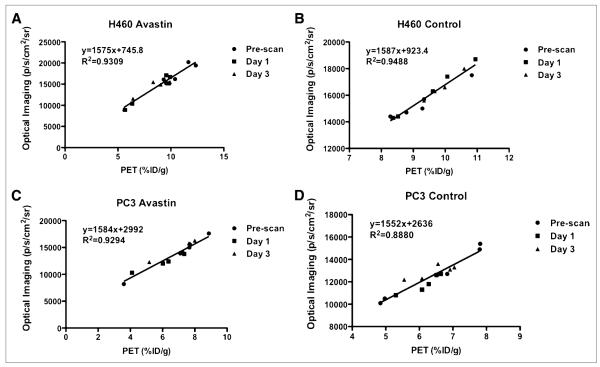
Results: On (18)F-FLT scans, both CLI and PET revealed significantly decreased signals from H460 xenografts in treated mice from pretreatment to day 3. Moderately increased to unchanged signals were observed in untreated mice. On (18)F-FDG scans, both CLI and PET showed relatively unchanged signals from PC3 tumors in both treated and control groups. Quantifications of tumor signals of Cerenkov luminescence and PET images showed that the 2 modalities had excellent correlations (R(2) > 0.88 across all study groups).
Conclusion: CLI and PET exhibit excellent correlations across different tumor xenografts and radiotracers. This is the first study, to our knowledge, demonstrating the use of CLI for monitoring cancer treatment. The findings warrant further exploration and optimization of CLI as an alternative to PET in preclinical therapeutic monitoring and drug screening.
Figures
References
-
- Weissleder R, Mahmood U. Molecular imaging. Radiology. 2001;219:316–333. - PubMed
-
- Xu Y, Liu H, Cheng Z. Harnessing the power of radionuclides for optical imaging: Cerenkov luminescence imaging. J Nucl Med. 2011;52:2009–2018. - PubMed
-
- Boschi F, Calderan L, D’Ambrosio D, et al. In vivo 18F-FDG tumour uptake measurements in small animals using Cerenkov radiation. Eur J Nucl Med Mol Imaging. 2011;38:120–127. - PubMed
Publication types
MeSH terms
Substances
Grants and funding
LinkOut - more resources
Full Text Sources
Other Literature Sources
Research Materials
Miscellaneous