. 2011 Dec;13(12):1171-82.
doi: 10.1593/neo.11888.

Ras-related tumorigenesis is suppressed by BNIP3-mediated autophagy through inhibition of cell proliferation

Affiliations

Ras-related tumorigenesis is suppressed by BNIP3-mediated autophagy through inhibition of cell proliferation

Shan-Ying Wu et al. Neoplasia. 2011 Dec.

Abstract

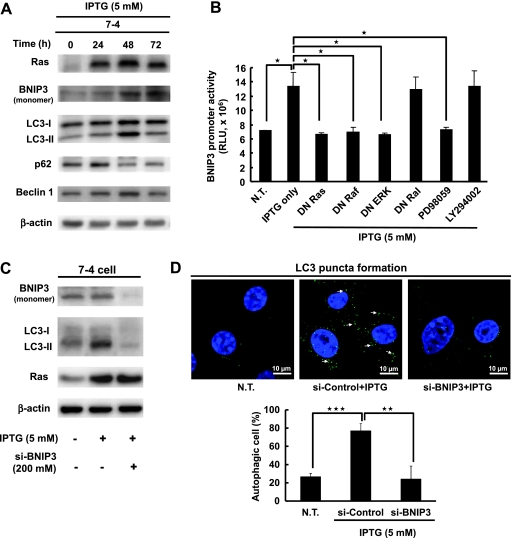
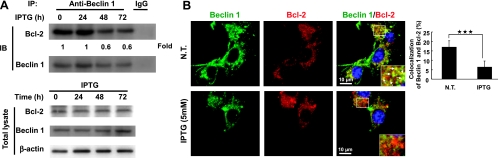
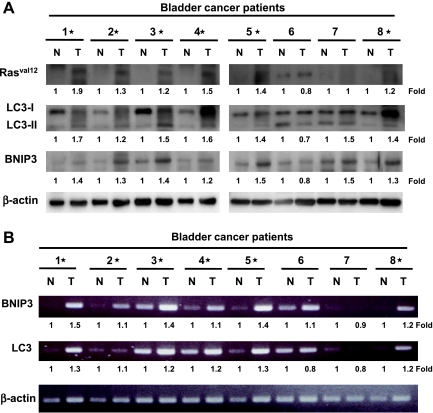
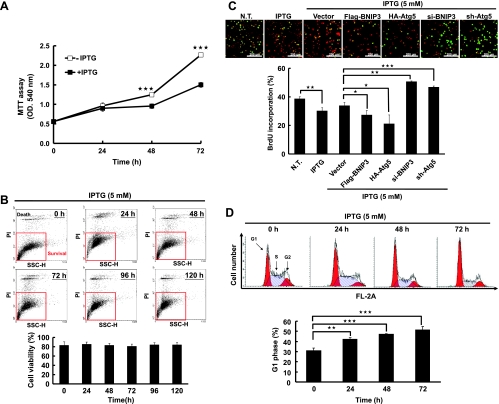
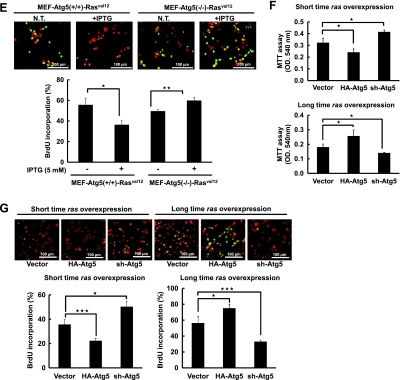
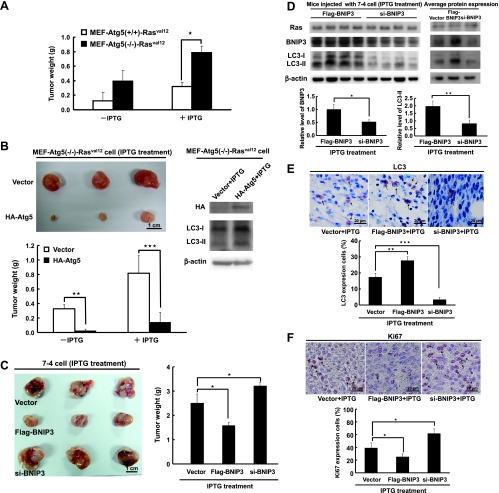
Autophagy plays diverse roles in Ras-related tumorigenesis. H-ras(val12) induces autophagy through multiple signaling pathways including Raf-1/ERK pathway, and various ERK downstream molecules of autophagy have been reported. In this study, Bcl-2/adenovirus E1B 19-kDa-interacting protein 3 (BNIP3) is identified as a downstream transducer of the Ras/Raf/ERK signaling pathway to induce autophagy. BNIP3 was upregulated by H-ras(val12) at the transcriptional level to compete with Beclin 1 for binding with Bcl-2. H-ras(val12)-induced autophagy suppresses cell proliferation demonstrated both in vitro and in vivo by expression of ectopic BNIP3, Atg5, or interference RNA of BNIP3 (siBNIP3) and Atg5 (shAtg5) using mouse NIH3T3 and embryo fibroblast cells. H-ras(val12) induces different autophagic responses depending on the duration of Ras overexpression. After a short time (48 hours) of Ras overexpression, autophagy inhibits cell proliferation. In contrast, a longer time (2 weeks) of Ras overexpression, cell proliferation was enhanced by autophagy. Furthermore, overexpression of mutant Ras, BNIP3, and LC3-II was detected in bladder cancer T24 cells and the tumor parts of 75% of bladder cancer specimens indicating a positive correlation between autophagy and tumorigenesis. Taken together, our mouse model demonstrates a balance between BNIP3-mediated autophagy and H-ras(val12)-induced tumor formation and reveals that H-ras(val12) induces autophagy in a BNIP3-dependent manner, and the threshold of autophagy plays a decisive role in H-ras(val12)-induced tumorigenesis. Our findings combined with others' reports suggest a new therapeutic strategy against Ras-related tumorigenesis by negative or positive regulation of autophagic activity, which is determined by the level of autophagy and tumor progression stages.


Figures

Figure 1
Figure 1
BNIP3 regulates H-rasval12-induced autophagy. (A) The 7-4 cells were treated with IPTG for different periods. Total protein extracts and the expression levels of Ras, BNIP3, LC3, p62, and Beclin-1 were evaluated by Western blot analysis using specific antibodies. β-Actin was used as an internal control. (B) The 7-4 cells in the presence of IPTG were cotransfected with BNIP3 reporter plasmid pGL3-BNIP3 together with various DN gene plasmids (DN Ras, DN Raf, DN ERK, and DN Ral) and treated with MEK inhibitor (PD98059) and PI3K inhibitor (LY294002) for 24 hours after transfection. The BNIP3 promoter activity of each group was measured by the Dual-Glo luciferase assay system. NT indicates the cells without any treatment. This experiment was conducted in triplicate and repeated at least three times. (C) The 7-4 cells were transfected with BNIP3 siRNA (200 mM) and RNAi-negative control (200 mM) for 48 hours by Lipofectamine 2000. The expression levels of BNIP3, LC3, and Ras protein were measured by Western blot analysis. (D) The 7-4 cells were transfected with BNIP3 siRNA (200 mM) and RNAi-negative control (200 mM) for 48 hours, and LC3 puncta were investigated under a confocal fluorescent microscope with anti-LC3 antibody and detected by fluorescein isothiocyanate-conjugated goat anti-rabbit IgG. NT indicates the cells without any treatment. Cells containing 30 or more green LC3 puncta were defined as autophagic cells. Thirty cells were evaluated by field, and three fields were counted. Error bars represent SD. *P < .05, **P < .01, or ***P < .001. Student's t test.
Figure 2
Figure 2
H-rasval12-induced BNIP3 triggers the release of Beclin 1 from Beclin 1-Bcl-2 complex. (A) The 7-4 cells after IPTG treatment for 24, 48, and 72 hours; the total protein extract was immunoprecipitated by anti-Beclin 1 antibodies and followed by immunoblot analysis to evaluate the levels of Bcl-2 and Beclin 1. (B) With or without IPTG treatment of 7-4 cells for 48 hours, the decreased colocalization of Beclin 1 (green) and Bcl-2 (red) was assessed under a fluorescence microscope. The white arrow points the colocalization of Bcl-2 and Beclin 1 (yellow spots). The percentage of colocalization of Beclin 1 and Bcl-2 was quantified by counting the yellow dots in the cell. Error bars represent SD. ***P < .001. Student's t test.
Figure 3
Figure 3
Mutant Rasval12 together with BNIP3 and LC3-II overexpression is detected in the tumor parts of the bladder cancer specimens. (A) Immunoblot analysis of eight paired human bladder cancer specimens (tumor [T] and adjacent normal tissue [N]) for Pan-Rasval12, LC3, and BNIP3 protein expression using specific antibodies. (B) The RNA of the above specimens was extracted for BNIP3 and LC3 expression by RT-PCR analysis. *Overexpression of Rasval12, BNIP3, and LC3-II of the protein (A) and RNA (B) comparing the tumor versus normal tissue.
Figure 4
Figure 4
Autophagy suppresses H-rasval12-induced cell proliferation. (A) The 7-4 cells were treated with or without IPTG for 24, 48, and 72 hours. Cell growth was measured by MTT assay. (B) The 7-4 cells were treated with IPTG (5 mM) for 24, 48, 72, 96, and 120 hours and followed by PI (0.04 mg/ml) labeling. Cell viability was evaluated by flow cytometry analysis, and cell population and quantitative data were shown. (C) The 7-4 cells in the presence of IPTG were transfected with plasmids pFlag-BNIP3 (4 µg), pHA-Atg5 (4 µg), psh-Atg5 (4 µg), si-BNIP3 (200 mM), or pFlag-CMV2 (Vector) for 48 hours. Cell proliferation was determined by BrdU (0.02 g/ml) incorporation for 30 minutes. Anti-BrdU antibody and PI were used to label the treated cells for cell proliferation and nuclei, respectively. The merged images showing green or yellow fluorescent cells represent proliferating cells, which were used to quantify the percentage of cell proliferation. (D) The 7-4 cells were treated with IPTG for various times, and cell cycle was analyzed by PI staining followed by flow cytometry analysis. (E) The MEF-Atg5(+/+)-Rasval12 and MEF-Atg5(-/-)-Rasval12 cells with or without IPTG treatment for 48 hours. Cell proliferation was measured by BrdU staining. This experiment was conducted in triplicate and was repeated for three times. (F) The 7-4 cells received two different treatments: 1) Short-time IPTG induction. The 7-4 cells were transfected with plasmid pHA-Atg5, psh-Atg5, or pHA-CMV (vector) for 48 hours followed by IPTG induction for another 48 hours. 2) Long-time IPTG induction. The 7-4 cells were treated IPTG for 14 days and in the presence of IPTG followed by transfection with pHA-Atg5, psh-Atg5, or pHA-CMV plasmids for 48 hours. Cell proliferation was measured by MTT assay. (G) The 7-4 cells received the same treatment as in F were analyzed by BrdU incorporation assay for cell proliferation. Error bars represent SD. *P < .05, **P < .01, or ***P < .001. Student's t test)
Figure 4
Figure 4
Autophagy suppresses H-rasval12-induced cell proliferation. (A) The 7-4 cells were treated with or without IPTG for 24, 48, and 72 hours. Cell growth was measured by MTT assay. (B) The 7-4 cells were treated with IPTG (5 mM) for 24, 48, 72, 96, and 120 hours and followed by PI (0.04 mg/ml) labeling. Cell viability was evaluated by flow cytometry analysis, and cell population and quantitative data were shown. (C) The 7-4 cells in the presence of IPTG were transfected with plasmids pFlag-BNIP3 (4 µg), pHA-Atg5 (4 µg), psh-Atg5 (4 µg), si-BNIP3 (200 mM), or pFlag-CMV2 (Vector) for 48 hours. Cell proliferation was determined by BrdU (0.02 g/ml) incorporation for 30 minutes. Anti-BrdU antibody and PI were used to label the treated cells for cell proliferation and nuclei, respectively. The merged images showing green or yellow fluorescent cells represent proliferating cells, which were used to quantify the percentage of cell proliferation. (D) The 7-4 cells were treated with IPTG for various times, and cell cycle was analyzed by PI staining followed by flow cytometry analysis. (E) The MEF-Atg5(+/+)-Rasval12 and MEF-Atg5(-/-)-Rasval12 cells with or without IPTG treatment for 48 hours. Cell proliferation was measured by BrdU staining. This experiment was conducted in triplicate and was repeated for three times. (F) The 7-4 cells received two different treatments: 1) Short-time IPTG induction. The 7-4 cells were transfected with plasmid pHA-Atg5, psh-Atg5, or pHA-CMV (vector) for 48 hours followed by IPTG induction for another 48 hours. 2) Long-time IPTG induction. The 7-4 cells were treated IPTG for 14 days and in the presence of IPTG followed by transfection with pHA-Atg5, psh-Atg5, or pHA-CMV plasmids for 48 hours. Cell proliferation was measured by MTT assay. (G) The 7-4 cells received the same treatment as in F were analyzed by BrdU incorporation assay for cell proliferation. Error bars represent SD. *P < .05, **P < .01, or ***P < .001. Student's t test)
Figure 5
Figure 5
Autophagy inhibits cell proliferation to suppress Ras-induced tumor formation. (A) The MEF-Atg5(+/+)-Rasval12 and MEF-Atg5(-/-)-Rasval12 cells (5 x 10⁵) with or without IPTG treatment were injected s.c. into SCID mice. The tumor weight was measured at 14 days after IPTG induction. (B) The MEF-Atg5(-/-)-Rasval12 cells with or without IPTG treatment were transfected with HA-Atg5 (pHA-Atg5; 4 µg) or vector (pHA-CMV) for 48 hours. The cells (5 x 10⁵) were injected s.c. into SCID mice. Each group composed of three mice. The tumor weight was measured at 13 days after IPTG induction. (C) The 7-4 cells (1 x 10⁶/well) after transfection of BNIP3 siRNA (200 mM), pFlag-BNIP3, or vector control plasmid DNA (24 µg) for 48 hours in the presence of IPTG were injected into the left and right sides of each mouse. Mice were fed with IPTG (12.5 mM) containing water for 15 days. (D) Protein extracted from the tumors of the killed mice was analyzed by immunoblot analysis for Ras, LC3, and BNIP3 protein expression. There were four mice in each group. Left panel shows the protein expression of each of the four treated mice; the right panel represents the average protein expression of four mice protein mixture. (E) The sections from the tumors were labeled with rabbit-conjugated LC3 antibody for LC3 expression. The arrows point at the LC3 expressing cells. (F) Representative sections of the tumors were labeled with anti-Ki67 antibody to detect Ki67 expression. The arrows point at the Ki67-positive cells. Error bars represent SD. *P < .05, **P < .01, or ***P < .001. Student's t test.

Similar articles

Cited by

References

    1. Maiuri MC, Zalckvar E, Kimchi A, Kroemer G. Self-eating and self-killing: crosstalk between autophagy and apoptosis. Nat Rev Mol Cell Biol. 2007;8:741–752. - PubMed
    1. Mizushima N. Autophagy: process and function. Genes Dev. 2007;21:2861–2873. - PubMed
    1. Yoshimori T. Autophagy: a regulated bulk degradation process inside cells. Biochem Biophys Res Commun. 2004;313:453–458. - PubMed
    1. Lamark T, Kirkin V, Dikic I, Johansen T. NBR1 and p62 as cargo receptors for selective autophagy of ubiquitinated targets. Cell Cycle. 2009;8:1986–1990. - PubMed
    1. Mathew R, Karp CM, Beaudoin B, Vuong N, Chen G, Chen HY, Bray K, Reddy A, Bhanot G, Gelinas C, et al. Autophagy suppresses tumorigenesis through elimination of p62. Cell. 2009;137:1062–1075. - PMC - PubMed

Publication types

MeSH terms

LinkOut - more resources