. 2012 Jan;8(1):e1002306.
doi: 10.1371/journal.pcbi.1002306. Epub 2012 Jan 5.

Short conduction delays cause inhibition rather than excitation to favor synchrony in hybrid neuronal networks of the entorhinal cortex

Affiliations

Short conduction delays cause inhibition rather than excitation to favor synchrony in hybrid neuronal networks of the entorhinal cortex

Shuoguo Wang et al. PLoS Comput Biol. 2012 Jan.

Abstract

How stable synchrony in neuronal networks is sustained in the presence of conduction delays is an open question. The Dynamic Clamp was used to measure phase resetting curves (PRCs) for entorhinal cortical cells, and then to construct networks of two such neurons. PRCs were in general Type I (all advances or all delays) or weakly type II with a small region at early phases with the opposite type of resetting. We used previously developed theoretical methods based on PRCs under the assumption of pulsatile coupling to predict the delays that synchronize these hybrid circuits. For excitatory coupling, synchrony was predicted and observed only with no delay and for delays greater than half a network period that cause each neuron to receive an input late in its firing cycle and almost immediately fire an action potential. Synchronization for these long delays was surprisingly tight and robust to the noise and heterogeneity inherent in a biological system. In contrast to excitatory coupling, inhibitory coupling led to antiphase for no delay, very short delays and delays close to a network period, but to near-synchrony for a wide range of relatively short delays. PRC-based methods show that conduction delays can stabilize synchrony in several ways, including neutralizing a discontinuity introduced by strong inhibition, favoring synchrony in the case of noisy bistability, and avoiding an initial destabilizing region of a weakly type II PRC. PRCs can identify optimal conduction delays favoring synchronization at a given frequency, and also predict robustness to noise and heterogeneity.


Conflict of interest statement

The authors have declared that no competing interests exist.

Figures

Figure 1
Figure 1. Measurement of the PRC and construction of hybrid circuits.
A1. Dynamic clamp setup used to measure phase resetting curves in a pharmacologically isolated neuron. A2. Baseline current is applied to induce the neuron to fire repetitively (upper trace) then a simulated synaptic conductance (lower trace) is turned on after a stimulus interval ts and the next spike occurs after a recovery interval tr. The interval Pj containing the perturbation in general has a different length than the average unperturbed interval (Pi). A3. The normalized change in cycle length (Pj−Pi)/Pi is called the phase resetting and is plotted versus the phase in the cycle at which the input was applied, calculated as ts/Pi. The solid curve is a polynomial approximation of the mean phase resetting. B1. The dynamic clamp setup used to simulate synaptic conductances in two otherwise isolated biological neurons. Synapse activation was triggered by an action potential in the partner neuron, but a delay between the action potential and the delivery of the synaptic input to the partner neuron was programmed into the dynamic clamp. B2. Membrane potential recordings from hybrid circuits show alternating time lags in a one-to-one locking.
Figure 2
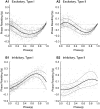
Figure 2. Typical PRCs measured with the Dynamic Clamp.
In all cases, the best polynomial fit to the data is an estimate of the mean PRC (thick curve), and the envelopes (thin curves) are plotted one standard deviation above and below the mean to indicate how the variance in the data depends upon phase. A. PRCs in response to a virtual excitatory synapse. The variability of excitatory PRC decreases at late phases. A1. For Type I there is a single extremum indicating only advances. A2. Type II PRCs have more than one extremum and both delays and advances. B. PRCs in response to a virtual inhibitory synapse. The variability of inhibitory PRC is less phase-dependent. B1. For Type I there is a single extremum indicating only delays. A2. Type II PRCs again have more than one extremum and both delays and advances.
Figure 3
Figure 3. Typical firing patterns observed in excitatory hybrid circuits.
A. Time lags observed in two hybrid circuits, one indicated by filled circles and the other by open squares, at different delay values. Due to constraints imposed by the duration that the experimental preparation remains viable, the full range of delays was not explored in any single circuit, but the type of patterns observed as the delay was increased was consistent across preparations. B. The red and blue arrows show the delay between action potential firing in one neuron and the arrival of an input to the other neuron. B1. Leader follower modes were observed at short delays (5 ms delay with intrinsic periods near 150 ms). B2. Near anti-phase modes were observed at intermediate delays (40 ms delay with intrinsic periods near 70 ms). B3. As delays were increased still further, a sharp transition to synchrony (one time lag near zero) was observed (50 ms delay with intrinsic periods near 70 ms).
Figure 4
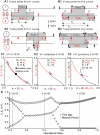
Figure 4. Graphical method for determining the periodic modes a two neuron circuit with conduction delays can exhibit.
A. Periodicity constraints imposed by a pattern in which a spike in one neuron influences via a feedback loop the timing of the very next spike (k = 1) in the same neuron. B. Periodicity constraints imposed by a pattern in which a spike in one neuron influences via a feedback loop the timing of the second spike, but not the very next spike (k = 2) in the same neuron. C. Curves constructed, one for each neuron, for two identical neurons with a PRC as in Fig. 2A1, using the dependence of the stimulus and recovery intervals on the phase. The abscissa and ordinate points are reversed for one neuron as compared to the other so that intersections of the curves satisfy the appropriate periodicity constraints given in A or B. C1. At a normalized delay of 0.04, the open circles indicate unstable modes with two unequal time lags; either neuron can lead so there are two bistable modes. The dark circle indicates that the antiphase mode with two equal time lags is unstable. For stable points, the black curve is steeper than the red at the point of intersection. C2. For a normalized time lag of 0.40, the antiphase mode becomes stable as indicated by the open circle. C3. For normalized delays of 0.80, synchrony with one zero time lag becomes stable. D. The graphical method was applied at each value of the normalized delay in increments of 0.02. The time lags were calculated using the algebraic relationship of these quantities with the stimulus and recovery intervals shown in A or B as appropriate. Only time lags associated with stable modes (X symbols) were plotted. In addition, the network period, or sum of the time lags, was plotted as the gray circles.
Figure 5
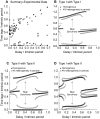
Figure 5. Experimental results are consistent with PRC-based predictions for excitatory hybrid circuits.
A. Summary data from hybrid circuits (n = 11). The time lags and delays were normalized by the period of the slower neuron in the pair. Each symbol indicates a different hybrid circuit. As delays are increased, transitions from leader follower through antiphase to synchrony are observed. B. Predicted hybrid circuit activity for two identical cells with Type I PRCs as the delay is varied (same as Fig. 4D without the network period. C. Predicted hybrid circuit activity for two identical cells with Type II PRCs as the delay is varied. The filled circles show how the solution structure is disrupted by a 4% difference in intrinsic period between the component neurons. D. Predicted hybrid circuit activity for two cells with the same period but in this case one has a Type I PRC and the other has a Type II PRC. Note: The absence of symbols at a particular delay in Fig. 5A indicates that those delays were not sampled experimentally. On the other hand, the absence of symbols at the regularly sampled intervals in Fig. 5D indicates that no stable modes were predicted at those delays.
Figure 6
Figure 6. Relationship of the delay to the locking point in the synchronous mode.
A. For a periodic one to one locking, the steady state values of the stimulus (tsi) and recovery (tri) intervals is indicated by the index [∞]. A1. For a circuit of two identical neurons with identical conduction delays δ, if the two neurons fire at the same time, then each neuron receives an input at a phase of δ/Pi, where Pi is the intrinsic period of neuron i. A2. As the recovery interval shrinks to its theoretical limit of zero, the phase at which an input is received is still δ/Pi the network period is now equal to the delay, which was not the case for shorter delays. B. Slightly different intrinsic periods, conduction delays or both perturb exact synchrony such that there is a small time lag ε between the firing of the neurons. If the perturbed locking points remain in a nearly linear neighborhood of the locking point for the homogeneous circuit, then an exact expression can be derived for ε (see text and derivation in Text S1).
Figure 7
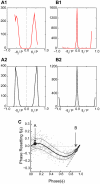
Figure 7. Noisy map based on the PRC accounts for the tight synchrony near the causal limit.
Histograms from the hybrid circuit shown in Fig. 3B2 with a delay of 40 ms (A1) and in Fig. 3B3 with a delay of 50 ms (B1), relative to an intrinsic period of about 70 ms. Histogram peaks for the synchronous mode at the longer delay are much narrower than for the antiphase mode. Histograms were also generated by a noisy map based on a hypothesized circuit composition of two cells with Type II PRCs as in (C). For a normalized delay of 0.55 a histogram with two wide peaks (A2) corresponding to an antiphase mode results. As the normalized delay is increased to 0.9, an abrupt transition to synchrony with a much narrower peak (B2) is observed. C. The locking point for antiphase (filled circle marked A) falls in a much noisier region of the PRC than the locking point for synchrony (open circle marked B). The dashed line indicates the causal limit.
Figure 8
Figure 8. Experimental results are consistent with PRC-based predictions for inhibitory hybrid circuits.
A. Summary data from six inhibitory hybrid circuits. The time lags and delays were normalized by the period of the slower neuron. Each symbol indicates a different hybrid circuit. B. Predicted hybrid circuit activity (X symbols) for two identical Type I PRCs (see Fig. 2 B1) as the delay is varied. The predicted time lags with 4% heterogeneity in period (filled circles) C) Predicted hybrid circuit activity (X symbols) for two identical Type II PRCs (see Fig. 2B2) as the delay is varied. The predicted time lags with 4% heterogeneity in period (filled circles) D) Predicted hybrid circuit activity for a Type I PRC with a Type II PRC with identical periods (X symbols) or with 4% heterogeneity in period (filled circles) as the delay is varied.
Figure 9
Figure 9. Typical firing patterns observed in inhibitory hybrid circuits.
A. Representative data for a single hybrid circuit coupled with inhibition. Time lags and delays were normalized by the period of the slower neuron. B. The red and blue arrows show the delay between action potential firing in one neuron and the arrival of an input to the other neuron. B1. An antiphase mode observed at a normalized delay of 0.09 is representative of the firing patterns observed at the shortest delays. Intrinsic periods for this pair were approximately 80 ms. B2. Bistability between synchrony and anti-phase is observed at the sharp transition near a normalized delay of 0.19. B3. Near synchrony observed at a delay of 0.31.
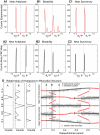
Figure 10
Figure 10. Noisy map based on the PRC exhibits bistability and shows when one bistable mode is favored over the other.
Experimental histograms corresponding to the data illustrated in Fig. 9 B1, B2 and B3 with normalized delays of 0.09, 0.19 and 0.31 are shown for near antiphase (A1), bistability (B1) and near synchrony (C1) respectively. The output of the noisy map is shown for antiphase (A2), bistability (B2) and near synchrony (C2) for a hypothetical circuit constructed of two neurons with Type II inhibitory PRCs (as in Fig. 2B2), at the same delays as for the corresponding experimental data. We introduced 4% heterogeneity in the intrinsic periods in order to reproduce the asymmetry in the experimental data. D) The right side shows the predicted solution structure for the hybrid circuit composed of two identical neurons with Type II inhibitory PRCs (as in Fig. 2B2). The deterministic stable solutions are indicated by the black circles, and the unstable ones are indicated by red diamonds. The gray circles are the output of the noisy map based on the PRC. The histograms at left were constructed using the noisy map for delays corresponding to each labeled arrow on the solution structure at right, with A for near antiphase, B for bistability, and C for near synchrony. The axes of the histogram are aligned so the ordinate scale matches the time lag scale on the ordinate of the bifurcation structure. Each peak in the histograms is centered on a stable solution branch at the corresponding slice in the bifurcation diagram. For the symmetric case of two identical neurons, bistability (B) has five peaks and near synchrony (C) has three. The experimental histograms shown at the top and those produced by the noisy map and shown in the middle row have one less peak for bistability and near synchrony. This is because heterogeneity causes one neuron to lead consistently in the near synchronous mode instead of the random leader switching observed in the homogeneous circuit.

References

    1. Bland BH, Colom LV. Extrinsic and intrinsic properties underlying oscillation and synchrony in limbic cortex. Prog Neurobiol. 1993;41:157–208. - PubMed
    1. Buzsáki G. Theta oscillations in the hippocampus. Neuron. 2002;33:325–340. - PubMed
    1. Squire LR, Zola-Morgan S. The medial temporal lobe memory system. Science. 1991;253:1380–1386. - PubMed
    1. Stewart M, Fox SE. Do septal neurons pace the hippocampal theta rhythm? Trends Neurosci. 1990;13:163–168. - PubMed
    1. Singer W. Synchronization of cortical activity and its putative role in information processing and learning. Annu Rev Physiol. 1993;55:349–374. - PubMed

Publication types

MeSH terms