

A model of ant route navigation driven by scene familiarity
- PMID: 22241975
- PMCID: PMC3252273
- DOI: 10.1371/journal.pcbi.1002336
A model of ant route navigation driven by scene familiarity
Abstract
In this paper we propose a model of visually guided route navigation in ants that captures the known properties of real behaviour whilst retaining mechanistic simplicity and thus biological plausibility. For an ant, the coupling of movement and viewing direction means that a familiar view specifies a familiar direction of movement. Since the views experienced along a habitual route will be more familiar, route navigation can be re-cast as a search for familiar views. This search can be performed with a simple scanning routine, a behaviour that ants have been observed to perform. We test this proposed route navigation strategy in simulation, by learning a series of routes through visually cluttered environments consisting of objects that are only distinguishable as silhouettes against the sky. In the first instance we determine view familiarity by exhaustive comparison with the set of views experienced during training. In further experiments we train an artificial neural network to perform familiarity discrimination using the training views. Our results indicate that, not only is the approach successful, but also that the routes that are learnt show many of the characteristics of the routes of desert ants. As such, we believe the model represents the only detailed and complete model of insect route guidance to date. What is more, the model provides a general demonstration that visually guided routes can be produced with parsimonious mechanisms that do not specify when or what to learn, nor separate routes into sequences of waypoints.
© 2012 Baddeley et al.
Conflict of interest statement
The authors have declared that no competing interests exist.
Figures
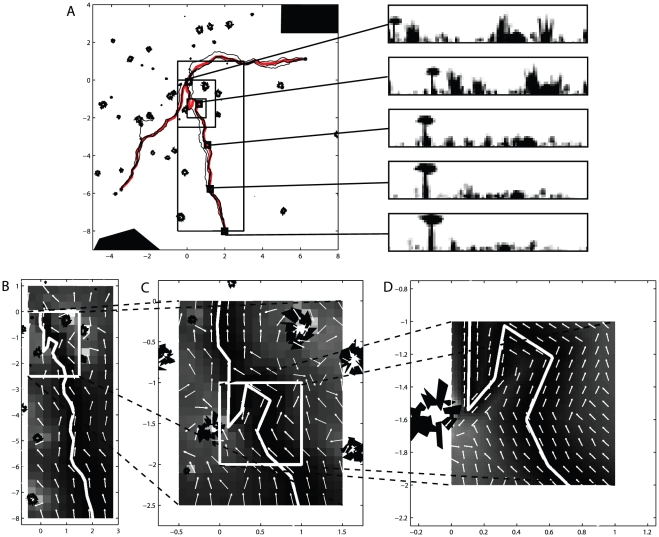
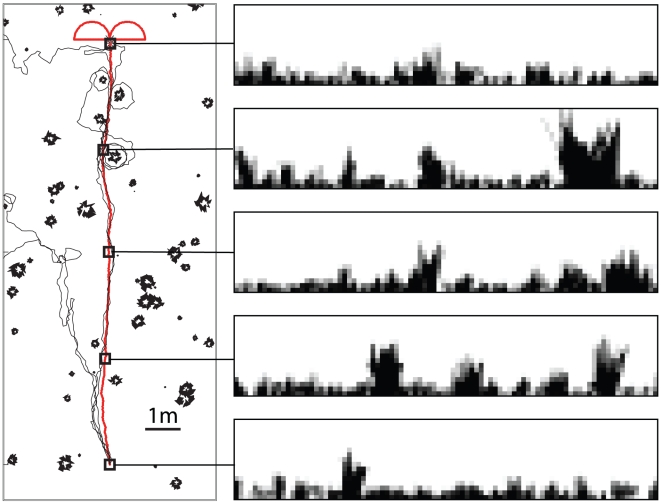
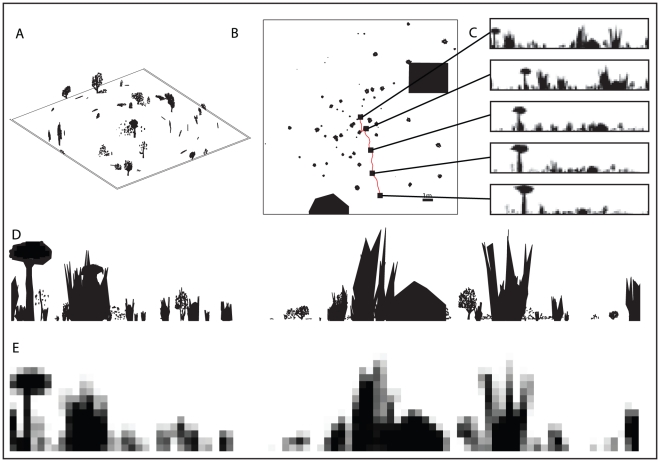
 . The panels to the right of the main figure show example views from points (indicated by squares) along the training route. B,C,D) Various sections of the middle route at a variety of different scales. The figures show the result of running the navigation algorithm at each point within a grid and indicate what action would be taken by an agent placed at that location. The white line indicates the training path and the white arrows indicate the directions that would be chosen from those locations. The underlying pseudocolour plot indicates the quality of the best match to the stored views for each position, with darker hues indicating a better match.
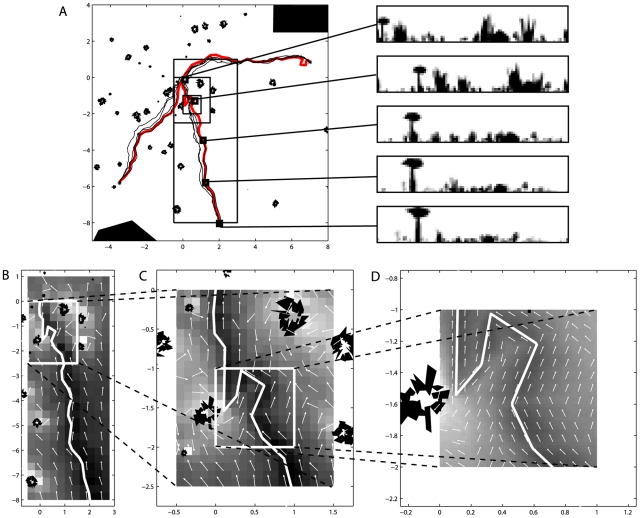
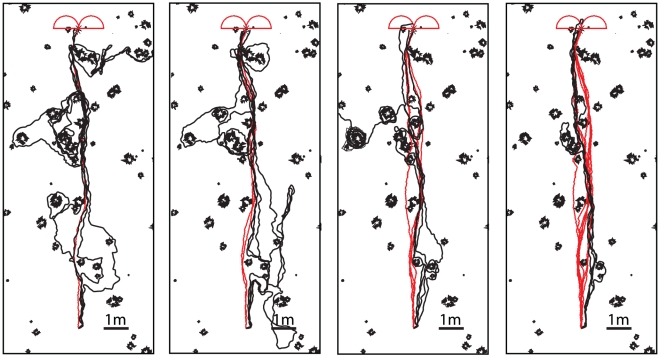
 added to the current heading at each timestep and a stepsize of 10 cm. B) A directed walk with a fixed heading of 0 and normally distributed noise with a standard deviation of
  added at each timestep with a stepsize of 10 cm.
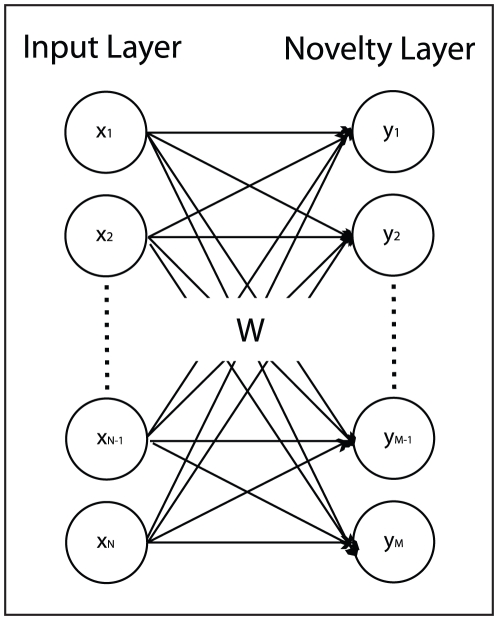
References
-
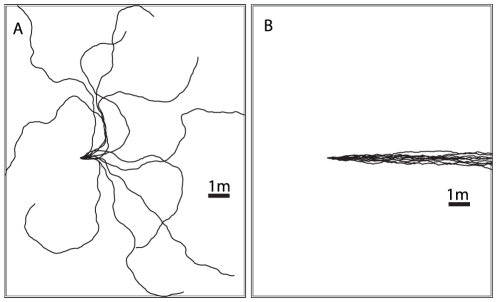
- Collett TS, Dillmann E, Giger A, Wehner R. Visual landmarks and route following in desert ants. J Comp Physiol A. 1992;170:435–442.
-
- Wehner R, Michel B, Antonsen P. Visual navigation in insects: Coupling of egocentric and geocentric information. J Exp Biol. 1996;199:129–140. - PubMed
-
- Kohler M, Wehner R. Idiosyncratic route-based memories in desert ants, Melophorus bagoti: How do they interact with path-integration vectors? Neurobiol Learn Mem. 2005;83:1–12. - PubMed
-
- Wehner R, Boyer M, Loertscher F, Sommer S, Menzi U. Ant navigation: One-way routes rather than maps. Curr Biol. 2006;16:75–79. - PubMed
-
- Narendra A. Homing strategies of the Australian desert ant Melophorus bagoti. II. Interaction of the path integrator with visual cue information. J Exp Biol. 2007;210:1804–1812. - PubMed
Publication types
MeSH terms
Grants and funding
LinkOut - more resources
Full Text Sources
Other Literature Sources
Research Materials
Miscellaneous
