. 2012 Jan;8(1):e1002337.
doi: 10.1371/journal.pcbi.1002337. Epub 2012 Jan 5.

A mathematical methodology for determining the temporal order of pathway alterations arising during gliomagenesis

Affiliations

A mathematical methodology for determining the temporal order of pathway alterations arising during gliomagenesis

Yu-Kang Cheng et al. PLoS Comput Biol. 2012 Jan.

Abstract

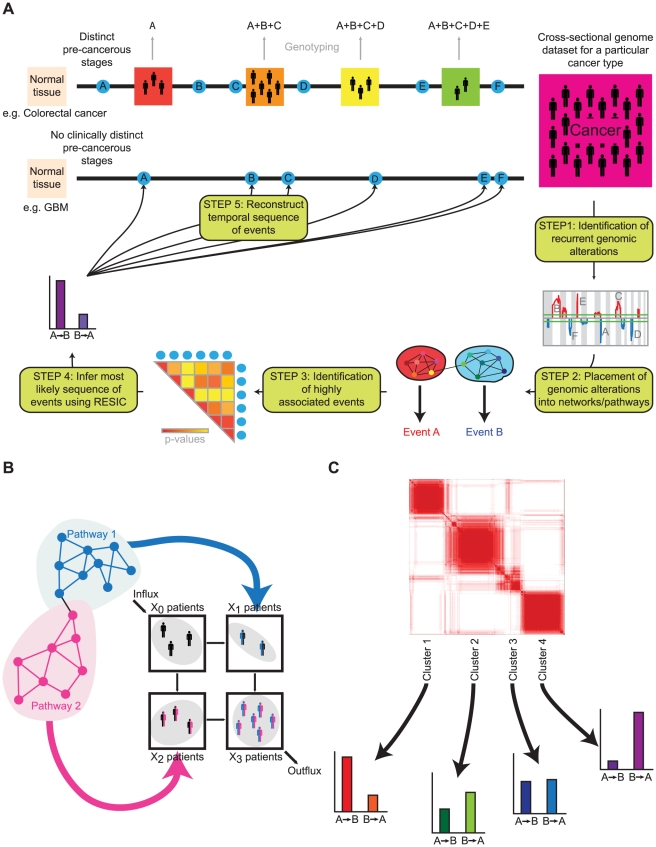
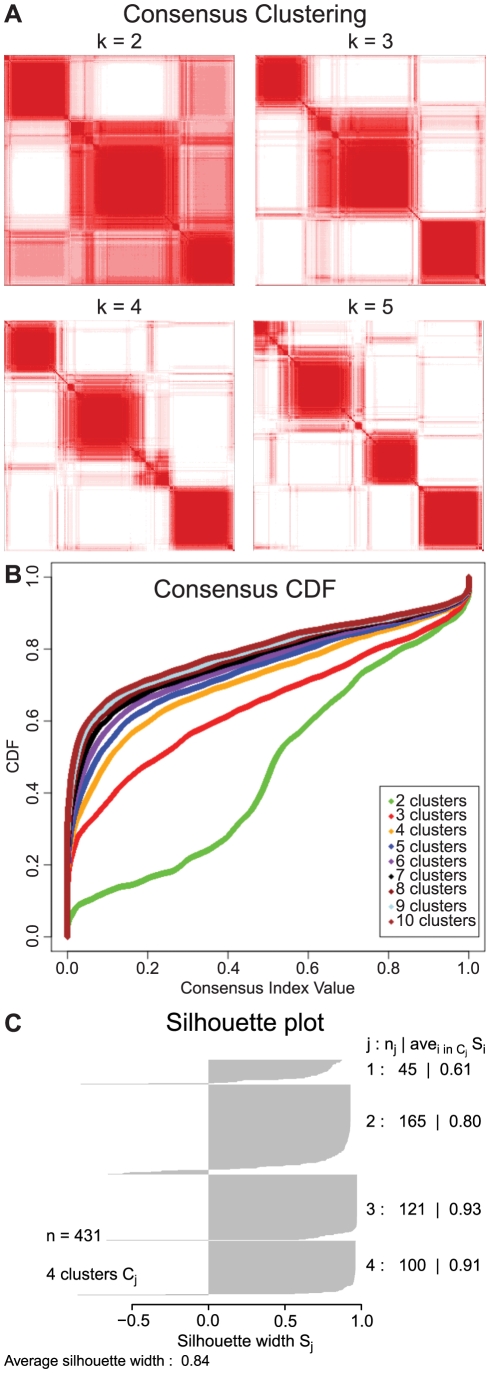
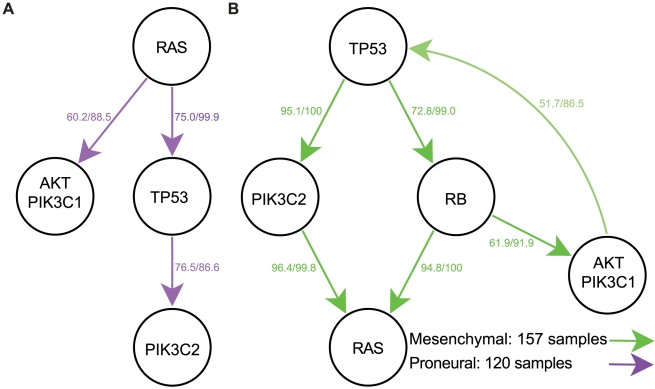
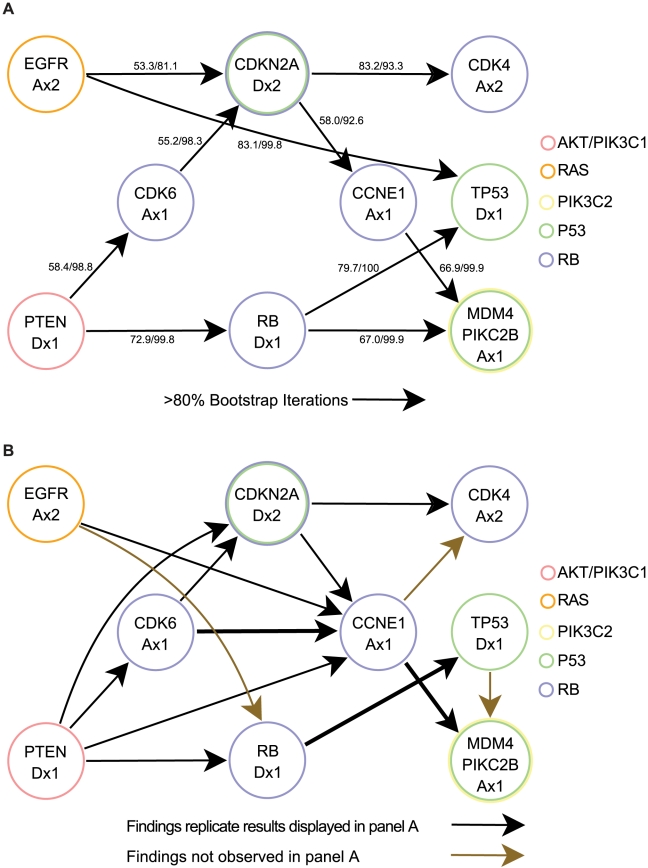
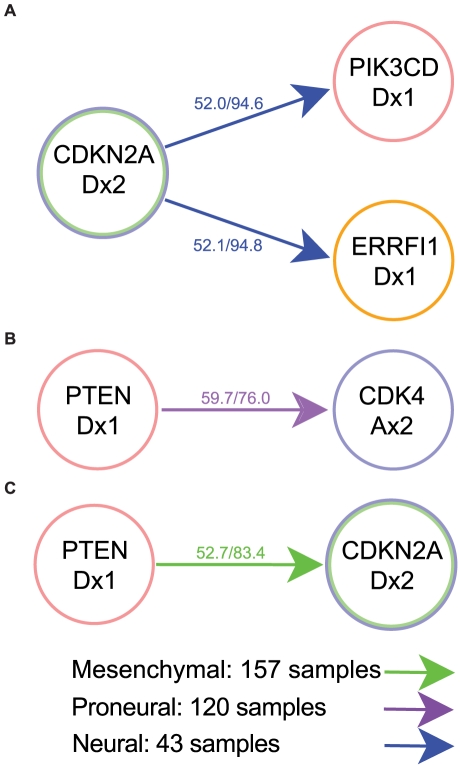
Human cancer is caused by the accumulation of genetic alterations in cells. Of special importance are changes that occur early during malignant transformation because they may result in oncogene addiction and thus represent promising targets for therapeutic intervention. We have previously described a computational approach, called Retracing the Evolutionary Steps in Cancer (RESIC), to determine the temporal sequence of genetic alterations during tumorigenesis from cross-sectional genomic data of tumors at their fully transformed stage. Since alterations within a set of genes belonging to a particular signaling pathway may have similar or equivalent effects, we applied a pathway-based systems biology approach to the RESIC methodology. This method was used to determine whether alterations of specific pathways develop early or late during malignant transformation. When applied to primary glioblastoma (GBM) copy number data from The Cancer Genome Atlas (TCGA) project, RESIC identified a temporal order of pathway alterations consistent with the order of events in secondary GBMs. We then further subdivided the samples into the four main GBM subtypes and determined the relative contributions of each subtype to the overall results: we found that the overall ordering applied for the proneural subtype but differed for mesenchymal samples. The temporal sequence of events could not be identified for neural and classical subtypes, possibly due to a limited number of samples. Moreover, for samples of the proneural subtype, we detected two distinct temporal sequences of events: (i) RAS pathway activation was followed by TP53 inactivation and finally PI3K2 activation, and (ii) RAS activation preceded only AKT activation. This extension of the RESIC methodology provides an evolutionary mathematical approach to identify the temporal sequence of pathway changes driving tumorigenesis and may be useful in guiding the understanding of signaling rearrangements in cancer development.


Conflict of interest statement

The authors have declared that no competing interests exist.

Figures

Figure 1
Figure 1. The methodology of pathway-driven RESIC.
A) A schematic diagram of pathway-driven RESIC. For those cancer types for which clinico-pathologically defined stages can be identified, such as colorectal cancer, the temporal sequence in which genetic alterations arise during tumorigenesis can be inferred through genotyping of samples from patients at different stages of disease progression. We previously designed an evolutionary computational algorithm called Retracing the Evolutionary Steps In Cancer (RESIC) to determine the temporal order of somatic mutations for cancer types that are diagnosed de novo without detectable precursor lesions (e.g. primary glioblastoma) through the use of genomic data from a large number of samples (one per patient) of a particular histological type . We extended this methodology to analyze the temporal sequence of functional alterations in signaling pathways. We begin with a genomic dataset of patient samples classified as the tumor (sub)type of interest. As Step 1, we use an algorithm such as GISTIC to identify recurrent genetic aberrations in the dataset. In Step 2, we combine genetic alterations identified as impacting specific signaling pathways into single alteration events. In Step 3, we identify statistically significantly correlated events that occur sufficiently frequently. In Step 4, the most likely sequence for each set of associated events is identified using RESIC. The results generated from the RESIC analyses are used to reconstruct the order in which pathway alteration events arise during the development of a particular cancer type (Step 5). Our methodology is applicable to large-scale datasets and can be used to identify the temporal sequence of pathway alterations in cancer. B) Functional modules in signaling result in single events analyzed in RESIC. C) Gene expression-based subtypes can be split up into separate RESIC analyses or analyzed as a combined dataset.
Figure 2
Figure 2. Temporal sequence of pathway alterations in all samples.
Alterations included as alterations of each pathway are defined in Table 1. Each arrow indicates the order in which the two alterations arise. The first number represents the frequency with which the displayed temporal sequence occurs. The second number represents the percent of all bootstrap iterations in which the order determined acts as the dominant temporal sequence.
Figure 3
Figure 3. Cluster analysis of the TCGA GBM patient data.
The stability of the clusters increases with the number of clusters and stabilizes around four clusters. A) Consensus matrix. The entry (i, j) in the consensus matrix measures the proportion of iterations of clustering in which the ith sample clusters with the jth sample. Assuming perfect clustering, all entries (i, j) in the consensus matrix would be either 0 or 1, representing either sample i never clustering with sample j, or always clustering with sample j. When the samples in the matrix are ordered according to their cluster, perfect consensus results in a block-diagonal matrix. Note that the stability of the clusters stabilizes at k = 4. B) Consensus CDF of the entries of the consensus matrix. With perfect clustering, all entries would be zero or one, resulting in a CDF consisting of a flat line at the percentage of zero entries in the consensus matrix and ending with a spike at one. The closer the CDF approaches this limit, the better the clustering. Note that the clustering stabilizes at k = 4, with little increase afterwards. C) Silhouette plot of the four clusters. Positive values on the silhouette plot identify samples that most stably represent each subtype. We exclude samples with zero or negative silhouette values to ensure only samples that fit the subtype are used in the subtyped RESIC analyses.
Figure 4
Figure 4. Temporal sequence of pathway alterations within subtypes.
The classical and neural subtypes did not result in any significant orderings of pathway alterations. Mutations included as alterations of each pathway are defined in Table 1. Each arrow indicates the order in which the two alterations arise. The first number represents the frequency with which the displayed temporal sequence occurs. The second number represents the percent of all bootstrap iterations in which the order determined acts as the dominant temporal sequence. A) The proneural subtype. B) The mesenchymal subtype.
Figure 5
Figure 5. Temporal sequence of somatic mutations in all samples.
Each arrow indicates the order in which the two alterations arise. A) Map of the temporal order of all CNAs determined using pairwise RESIC analyses. The first number represents the frequency with which the displayed temporal sequence occurs. The second number represents the percent of all bootstrap iterations in which the order determined acts as the dominant temporal sequence. B) Map of all CNAs made using three-mutation RESIC analyses. We tested the effects of including additional mutations in RESIC analyses by first testing the addition of a single mutation independently to each analysis. Investigation of further additions of mutations would require more samples; furthermore, we would expect any epistatic effects on the order of mutations to show some level of effect from each gene independently. Arrows in black are significant orderings, confirmed in at least 80% of the bootstrap iterations. Gold arrows are orderings found significant by three-way interactions, but not by pairwise interactions. Thickness of lines denotes the number of interactions that maintained the ordering. Since multiple three-gene analyses correspond to some arrows, the specific frequencies of orderings and the number of bootstrap iterations are not displayed, although included in the Supplementary Information. The results of using two mutations per RESIC analysis (A) do not differ significantly from the three mutation results (B). In no case is an order determined to be significant in pairwise analyses later found to be reversed in three way analyses. Additionally, we found that most results are stable (confirmed in three-way analyses) as long as the most likely evolutionary path through the mutational network comprises at least 58% of the flow. With the exception of the placement of PTEN of the AKT/PIK3C1 pathway, many of the orderings determined at the pathway level are robust at the gene level.
Figure 6
Figure 6. Temporal sequence of somatic mutations within subtypes.
The classical subtype did not result in any significant orderings of genetic alterations. A) Neural subtype. B) Proneural subtype. C) Mesenchymal subtype. In contrast to the results obtained when using pathway alterations, we obtained no significant results when performing gene-level analyses. In most cases, the temporal sequences occur with less than 58% probability, meaning the results are unlikely to remain robust to perturbation by addition of further genes. In the neural subtype, the sole significant temporal order determined involves PTEN loss arising before CDK4 amplification.

Similar articles

Cited by

References

    1. Bamford S, Dawson E, Forbes S, Clements J, Pettett R, et al. The COSMIC (Catalogue of Somatic Mutations in Cancer) database and website. Br J Cancer. 2004;91:355–358. - PMC - PubMed
    1. Sjöblom T, Jones S, Wood LD, Parsons DW, Lin J, et al. The consensus coding sequences of human breast and colorectal cancers. Science. 2006;314:268–274. - PubMed
    1. The Cancer Genome Atlas Research Network. Comprehensive genomic characterization defines human glioblastoma genes and core pathways. Nature. 2008;455:1061–1068. - PMC - PubMed
    1. Taylor BS, Barretina J, Socci ND, Decarolis P, Ladanyi M, et al. Functional copy-number alterations in cancer. PLoS One. 2008;3:e3179. - PMC - PubMed
    1. Beroukhim R, Getz G, Nghiemphu L, Barretina J, Hsueh T, et al. Assessing the significance of chromosomal aberrations in cancer: methodology and application to glioma. Proc Natl Acad Sci U S A. 2007;104:20007–20012. - PMC - PubMed

Publication types

Substances